For the CGO SQLite library we set _txlock=immediate which should result in BEGIN IMMEDATE for all our write transactions. I see we are missing that from the modernc connection string though, and it looks like it should support it. (Added.)
1 Like
Also the “begin immediate” is used to avoid later failing/blocking if multiple write transactions are ongoing and require a lock. We never have that as we serialize writes in go, so it simply doesn’t matter if we do begin immedate or just begin.
I’ve tried
maxDBConns = 2
and
"cache_size = -65536",
(back), and found it running all tasks on this my personal 10GB-db instance with 1M files, considerably nicer. No any problem in concurrency, and the GUI is responsive as well (this new http/2 version). However resource usage metrics are better and scans are faster.
This is not my final proposal for the numbers, but how the initial 16 connections were discovered? Maybe I am missing something?
UPD: at initial scan, it is unresponsive, and most probably needs more than 2 for main db, but it is unresponsive with 16 as well during this time, no matter a lot here.
UPD2: sweet sport for me personally is 4 connections for main, and 2 per folder DB, (I will gladly have 1 but 1 seems deadlock somewhere and don’t work). And the cache to something comparable to index sizes of the databases, so as much as you can afford, as you need this data anyway, at least when indexes are such big. In my situation I find it reasonable at 128MB - the instance with 4 parallel folders is within 500-700MB, (just multiply all altogether), during initial scan. In office-style situation, I found no reasons to have more than 2 connections in folder DB. Maybe I am seriously wrong here, but anyway I was running with GOMAXPROCS=1 all the years to make it max idle as possible, so best for me. Maybe I am missing other scenarios.
These numbers, in addition, compares very well with my personal v1 metrics.
UPD PROPOSAL: Dynamic cache size; you can set these PRAGMAs at any time as it seems; the idea is what when doing full scan, it is unavoidable to read all the indexes and better do cache it inside the app, to save on IO and context switches; this is pain anyway, so add resources to do this faster; when not, decrease the cache to go background. Need two knobs then. My pre-final proposal is these defaults: 4 for main, 2 cons for folder, 16mb cache default, 128mb full scan period default, 4 folders concurrent, and all adjustable. Just my 2cents. Well maybe 128 is a bit high. Maybe 16/16.
UPD: maybe sqlDB.SetConnMaxIdleTime (10 * time.Second) ?
Seems that SQLite does not drop the caches fast without a reason, so just increasing is not a good option - better with smaller connection limit (16→2), but still can be done even better. Without explicit dynamic PRAGMAs, I was really now trying sqlDB.SetConnMaxIdleTime (10 * time.Second). This works nice by closing DB files periodically and dropping caches faster and in a more definite way when folders are idle. So the cache can be a lot larger, when needed operational. But I am not sure than re-opening DBs is a good idea (when DB is idle, WAL gets deleted, this way you can look at which folders got DB closed). Closing DB is counter-inituitive, but at the same time, initial scan is up to 4 times faster (!) when I have a proper cache for the folder DB, like, at least, 10% of the file (larger than initial 64MB). (I am talking for >1GB DB files). Real dynamic caching change may be better because will not cause reopening overhead, but maybe this overhead is very minor. Works good for me with SetConnMaxIdleTime of 10 seconds. Just another my 2 cents.
UPD: you dont need to adjust SetMaxIdleConns, this is a different story.
UPD2: in my specific situation, this dirty trick of really large cache & idling connections fast to bring memory usage to normal bring scan speed back to v1 days actually! ![]() maybe it was last bit of latency going for the SQL data out-of-process.
maybe it was last bit of latency going for the SQL data out-of-process.
An added observation.
This idle 10 sec works fine for me, however, every 8 hours maintenance can take a lot of time, comparable to scan, and it can be tens of minutes on large db file. With max cons 2, it blocks any useful ops on folder for the same amount of time. Not sure about if it also will with more connections allowed. Is it supposed to block all the folder or not?
Syncthing v2.0.9 just got released which should reduce database size for deployments with large files tables.
1 Like
2.0.9 has killed my servers. disks are all 100% and unresponsive. v2 feels like it’s going backwards in performance. I hate to say it, but going back to v1 feels like it’s the best solution at the moment
1 Like
For some reason not stated in any readme on an update (except in the commit), but it is doing one more DB migration on the start. It is expected to do it long on some datasets, in fact, on my large datasets, it is doing it slower than v1 to v2 migration (full DB traversals are for some reason slow within v2 structure anyway). On one example huge instance I am migrating for the 24+ hours already (started after initial git commit, not waiting for the release), which is slower than v1→v2.
After that things should go better than before 2.0.9.
I’m aware that migration is taking place on these updates, however the length of time taken and the aggressiveness on the drives is concerning. If it were, say 20 minutes, I can tolerate that, however when we are looking at hours in a situation where clients are not able to access data, this is a serious issue. It’s also why I asked that these tweaks needed to be RC’s rather than releases
1 Like
I have a feeling that it is going a bit in a rush because initial v2 schema is a also a showstopper for many of the use cases. Migrating 1→2.0.9 is a lot better than 1→2.0.8 as an example, it can save A LOT of DB space. So releasing this version seems less of an evil.
Initially I was also skeptical about v2 design, but now we are trying internal a version with hashed indexes without full indexes for all the fields, and it is also doing a lot better than initial v2 schema, with indexes size equal to data (in hashed indexes, it is ~15% of the data, in our case), and with locality applied to hashes. Not PRing this because it breaks a lot of things inside which I just deleted for a moment (like part of exception rules which we dont use anyway, which translating to SQL that is not optimal without full indexes). However, with these tricks, it will be back to v1 version, I understand and confirm that now.
At some moment, I believe, Jakob will be ready for these tricks, and V2 will be efficient again (maybe at 2.1 or like that).
1 Like
Just to provide some data, after the migration on my main PC, the database has shrunken from 4.8 to 3.8 GB.
On a side note, would it be possible to allow HTTPS connections to the temporary GUI? At the moment, if you use HTTPS normally, it requires to specifically change the URL to http://, and then once the migration is done, you need to change it to https:// again, which is a bit cumbersome. ![]()
Would you mind sharing your database stats paired with some info about your cluster (devices, foldets, file count, avg size etc) after the dust has settled? Getting v2 in shape is a lot easier if we can pinpoint the remaining weak spots.
Just to also add, i’m going from 2.0.8 to 2.0.9 and is taking a huge amount of time. If I was going from v1 to v2, I can understand it, but a minor increment should not require a full migration
I feel like there is underestimation on how slow operation with files table is in v2 schema is now. It is leading to long scans, long and probably blocking maintenance, long folder status update, like, query for a folder status in GUI can be up to minutes, etc. At local Jakob tests it seems he just never face all of this on his hardware and dataset, and thus it is just, again, underestimated.
During all of these, syncthing process is just reading the table data from the filesystem. If you cannot cache the whole thing in a RAM, no matter SQLite page cache or OS file cache, you are going into the disaster now. The same with this migration.
UPD: that’s why I am about reducing every single bit of a size of this table, and also, improving lookups locality. Normalizing is a great step ahead, but as you kind of pretty much always join it together, sometimes it is not a lot of difference, compared to other means. Sure it helps a lot a case when there are huge count of the peers, but not always the case.
just to add the stats, this is an example on the same hardware and the same instance,
2025-09-04 16:56:30 INF syncthing v2.0.6 “Hafnium Hornet” (go1.25.0 windows-amd64) builder@github.syncthing.net 2025-09-03 07:27:53 UTC (log.pkg=main)
…
2025-09-04 17:01:13 INF Migration complete (files=1147007 blocks=1277 duration=4m40s log.pkg=syncthing)
completed in less than ten minutes,
and this is 2.0.8 to 2.0.9,
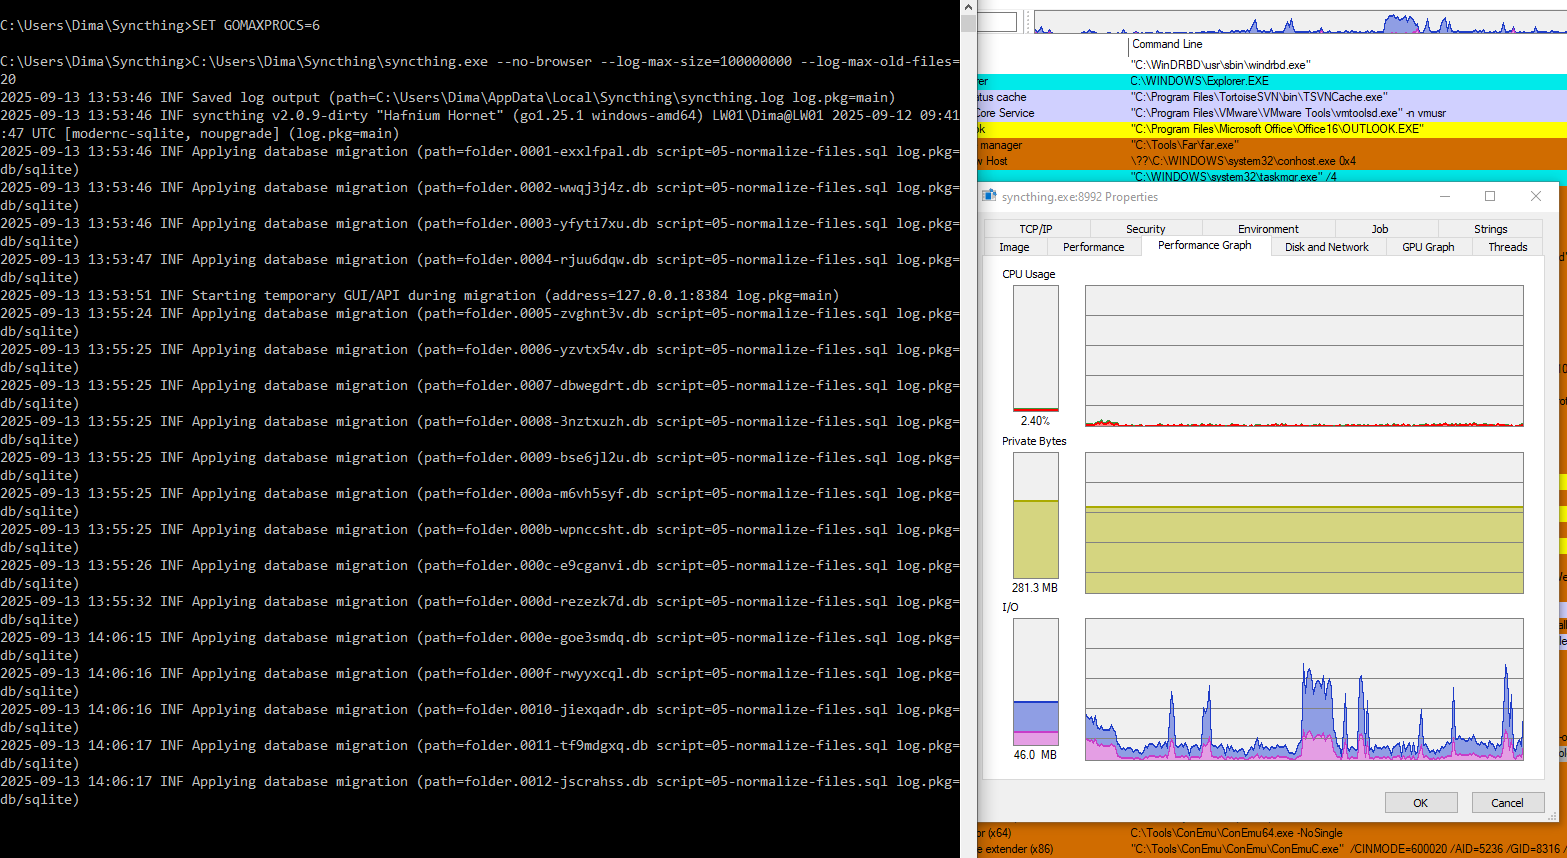
2025-09-13 13:53:46 INF syncthing v2.0.9-dirty “Hafnium Hornet” (go1.25.1 windows-amd64) LW01\Dima@LW01 2025-09-12 09:41:47 UTC [modernc-sqlite, noupgrade] (log.pkg=main) 2025-09-13 13:53:46 INF Applying database migration (path=folder.0001-exxlfpal.db script=05-normalize-files.sql log.pkg=db/sqlite)
…
and it is 15:46 already and it is still migrating on the half of the folders
given this, maybe, 2.0.9 release without a warning is indeed a problem
UPD: and this is with added patch to increase migration connection cache to a lot; without this, even much slower.
UPD: its only this huge table IO, not a CPU usage or whatever, and yes this is SSD -
UPD again - not complaining, fine for me, this all is just FYI and as a feedback
There is still a lot of tweaking going on, so I would say that these kind of migrations are to be expected. Honestly, if you need to have Syncthing running 24/7 with no longer pauses, then you should probably abstain from upgrading to every new version that comes out.
On the other hand, as already mentioned above, I think stats and other data from your systems could be very helpful in diagnosing other potential performance issues, so it would be great if you could share them ![]() .
.
2 Likes
More data is always better ![]()
At mine, with 1→2 migration as a reference within 5 minutes, and 800GB→10GB,
now, 0.8 to 0.9 migration took 3 hours, and it is 10GB→6GB now.
(I am sorry for misspelling Jakob, my bad, corrected all I found)
By the way, in the implementation I test now, I’ve found to do it better that stated above, my initial ideas were generic-all-db-will-go approach, but SQLite have better ways do to this.
This is what (test/benchmark) schema looks like -
CREATE TABLE IF NOT EXISTS names (
	id INTEGER PRIMARY KEY AUTOINCREMENT NOT NULL,
	parent_id INTEGER NOT NULL,
	name TEXT NOT NULL COLLATE BINARY
)
STRICT;
CREATE UNIQUE INDEX IF NOT EXISTS names_parent_id_hash32_name ON names (parent_id,HASH32(name));
and this is how we query -
WHERE HASH32(name)=HASH32(@name) AND name=@name
I also had to add:
INDEXED BY names_parent_id_hash32_name
or optimizer does not feel like it is OK,
and the function:
conn4.CreateFunction ("HASH32", (string input) => input.GetHashCode(), true);
(this is some generic string hash, kind of crc32) - we use the same with Go with CRC32,
It’s essentially the same as the initial approach, but we don’t need the column actually, this is kind of a way how SQLite does materialized views.
There are technical optimizations required here according to platform used. In C#, things are getting slower in sketch benchmark with custom functions due to slow interop to managed .NET. Still fast enough for overall solution to be better than without, though. Cant tell how exactly this should be done in Go. Best way to find unmanaged low-level hash function for this, not registering from the app code, but loaded as an extension. Unfortunately, found none really working, yet, so we are working with this managed runtime workaround, in both benchmarks (level db) and our test Go build.
(our test Go build is full-names-DB still, because of too many things to adjust to get to level-names only DB, I am not good at Go to implement that myself fast)
my update on success with altered configs on main:
Either 4 connections max for main DB, or 2 connections max per folder, or, SetConnMaxIdleTime (10 * time.Second), at least all together, is causing deadlocks, which do not resolve during night. Sympthoms are zero log activity (with standard verbosity) and zero useful operations. This happens only after massive updates like more than 10K files batches, so not very easy to reproduce.
Maybe the reasons are known/understood and I am not adding anything useful, maybe not, just FYI. I am now trying with 3 connections per folder.