Just out of curiosity, is there any performance impact by having the profiler always enabled? That’s what I’ve been doing for a very long time, as otherwise I definitely wouldn’t have been able to properly report all those issues ![]() .
.
I’m not sure. I think there may be an impact as I think it causes it to account allocations in a way that it otherwise wouldn’t. I could be wrong on this point.
While working on Synctrain I did notice that sometimes the config object seems to be locked for longer periods of time than before (this is immediately noticeable because the Synctrain UI reads it all the time - which eventually lead me to make those reads asynchronous from the Swift UI side, as they should be anyway). This was very intermittent, so very hard to pinpoint. Perhaps the config lock is held while one of these longer running queries is going on?
(I will try to grab a profile for this from the slow NAS, but as that’s a Synology I need to first figure out how to set the required arguments/envs. The support bundle is taking ages to export as well through the regular route).
EDIT: just had a browse through the code - if I understand correctly, the only thing that could realistically hold the config lock for a long time (apart from the Save function) is any Subscriber callback. There are quite a few subscribers, but model is the most complicated one (see model.CommitConfiguration). I don’t have time right now to fully trace whether that eventually ends up doing substantial database work, but that would be the next thing I would check.
2 Likes
Hmm, I think I’ve been running Syncthing with it enabled for years at this point. The reason was that when I was experiencing all those issues with Syncthing getting stalled and unresponsive, having the profiler enabled in advance was the only way to actually get the profiles, etc., especially since the issues weren’t exactly reproducible in most cases. I’ve basically kept it enabled on all devices since then, just in case (although I don’t need to use it very often nowadays ![]() ).
).
1 Like
I don’t think it hurts in any noticeable fashion. But it also doesn’t have authentication etc so we don’t recommend it on by default.
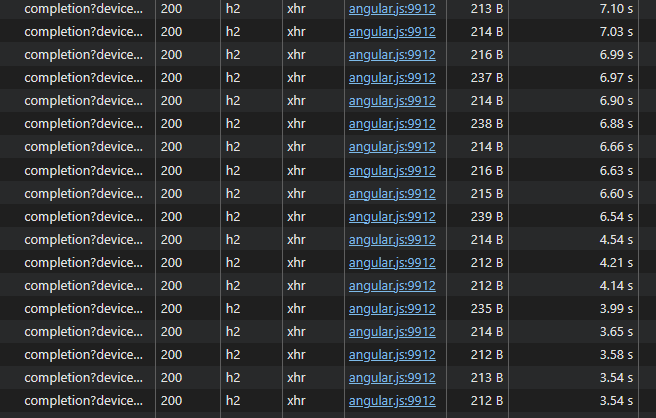
from @pixelspark screenshot we see connections are http/1.1 which is known to be maxed at ~6 max parellel connections in regular browsers. If expensive calls block, even fast ones could juste be waiting on line before being fired.
The UI could use some better polling logic to avoid overloads, also a very quick win is switching to http2 (spdy) when serving the GUI from the backend. If possible.
3 Likes
Fascinating, I had no idea. It requires HTTPS, but we should obviously support HTTP/2, which we currently don’t.
3 Likes
I think it may be good to state the performance benefits somewhere explicitly (e.g. either in the GUI itself, or if not possible, then in the Docs). I would assume the vast majority of users that don’t need remote access to the GUI also don’t enable HTTPS for it (as it does come with a disadvantage, which is browsers showing warnings about the self-signed certificate).
Edit:
The GUI does seem to reload much quicker with HTTP/2. Still not instant, but it’s more like 3 seconds vs 10 seconds before (when accessed remotely on a device with 50 folders and 10 remote devices).
1 Like
requests multiplexing ftw, I’m sad I didn’t catch this earlier, it’s a real quick win for SPA’s
Next improvement could be to make the polling a little smarter, not just hammering every 5 seconds the backend with requests when it struggles to respond ‘on time”
1 Like
I will provide go traces tomorrow, busy today. However GUI topic is stealing focus, the root is why syncthing cannot answer the call within minutes (tens of minutes)? For example during initial scan (and maybe during rescans too), we get zero responses for the folder as it seems, from the start to the end. It was not like that in 1.x.
And it indicates some internals got massively worse as well, not only gui/api.
Edit2: main box for my debug in this topic is not weak, it is full spec top dev machine.
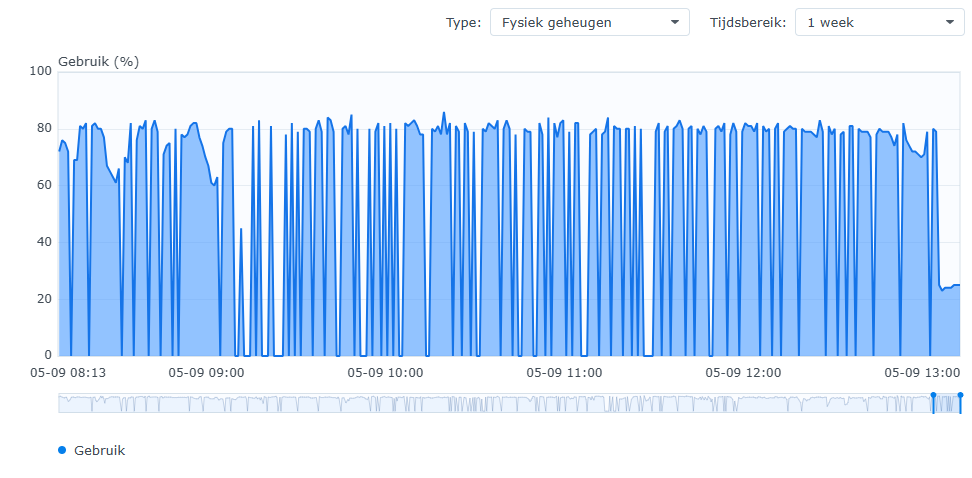
v2.0.7 massively improves the UI responsiveness on ‘the slow NAS’. The completion calls still take a few seconds, but that was minutes, and now none of the other stuff is hung up by it (and this is right after startup, so initial scan still ongoing) ![]()
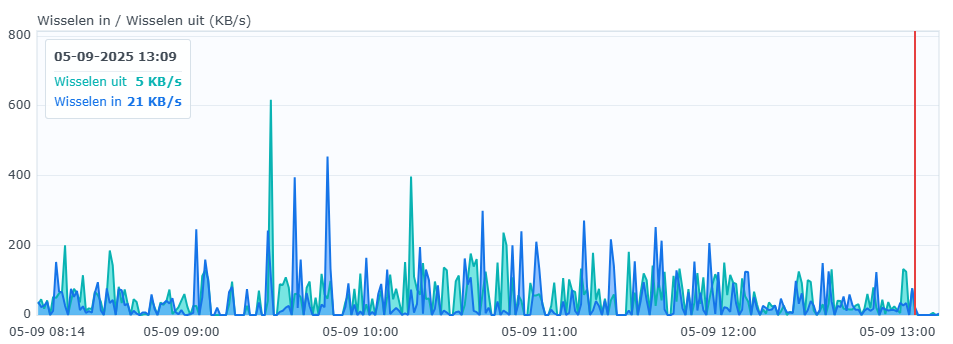
Memory/swap is also much better at first glance:
Fixing issues like the GUI responsiveness is very likely to help getting to the (much more complicated) underlying bottlenecks. What we need now is not further complaints about the performance and regression thereof - we all know already v2 is a bit slower - but rather actual measurements, clues / theories, and patches ![]()
3 Likes
I am not a go dev, so cannot patch, but i am clarifiyng things that maybe were missed by core devs.
Memory bloat x10 was obviois. Turned out that not. The same may be here. Is it obvious that the whole operation is under lock now, at least in effect? Not sure. Stated that.
Will do traces, best I can.
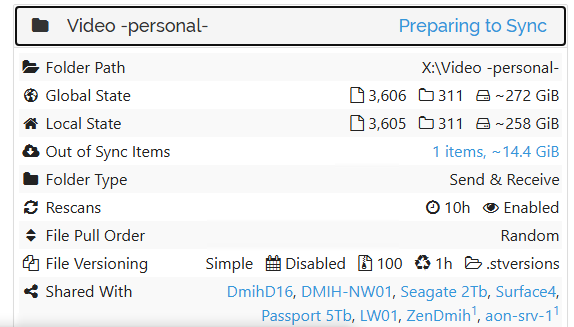
I’ve noticed something unusual. The instance in question, I’ve sent Support Bundle on it yesterday. After migration, SQLite DB was approx. 1.5GB. That was fine. Before migration it was approximately the same, around 1GB.
Yesterday during our tests it was around 2GB. Also fine.
Today DB size is 6.5GB already, and with overnight work, the instance is unresponsive. This is the current list - yesterday it was all around 4x times smaller, in the proportion. This node is 2.0.7-git-small-cache.
UPD: new data - The same is on the another node with the same dataset. During this night db was 2 → 6GB there. This node is 2.0.6.
Maybe all my slowdown reports are due to this?
(sorry bad list, will post edited as attachment)
db-exploded-list1.txt (4.8 KB)
The instances were doing nothing, just staying overnight.
EDIT2: I am not stopping this instances, and will now get the bundle..
EDIT3: bundles from both instances:
support-bundle-EBBXITJ-2025-09-05T161759.zip (678.6 KB)
support-bundle-NOEMNLL-2025-09-05T151803.zip (1.0 MB)
EDIT4: 3d 2.0.7 instance also bloated 2→6GB, stopping it, of no interest, all the same
EDIT5: I am on the move today, but will leave them keep bloating, and when I have time, will do whatever you ask to find the cause.
This is what we have up to now, ~1 hour passed, files keep growing,
05.09.2025 12:10 3.409.158.144 folder.0010-kdrx2nvc.db
05.09.2025 16:06 1.736.704 folder.0010-kdrx2nvc.db-shm
05.09.2025 16:07 884.646.456 folder.0010-kdrx2nvc.db-wal
(hour passed)
05.09.2025 17:43 3.437.797.376 folder.0010-kdrx2nvc.db
05.09.2025 17:43 2.752.512 folder.0010-kdrx2nvc.db-shm
05.09.2025 17:54 1.409.217.192 folder.0010-kdrx2nvc.db-wal
(example of a big folder)
If my theory (below) of what’s happening is right, those files will shrink when you stop looking ![]()
As in close the GUI and anything else that keeps calling the API. To actually see what’s happening, you could enable debug logging for db/sqlite - I am looking for lines containing “Checkpoint result”.
The WAL is reset when a full checkpoint can complete. And that requires that no reader that started before the latest write transaction is still active. Otherwise the checkpoint can potentially move almost all the data in the WAL over to the DB, but not the data just written. Even though most of the WAL is unused, as long as that bit of data at the end exists the file grows. And if lots of (slow) read operations are constantly happening, seems like this could realistically happen. I don’t think we have the metrics to check it, only the logs I mentioned above - maybe worth adding WAL stats to the prometheus metrics.
If this is really an issue I see the following way to improve on it:
Attempt checkpoints ahead of the write transaction when some threshold on WAL size resp. writes since last successful full checkpoint is exceeded. Doing it afterwards means that it can only ever succeed if no read operation takes longer than the write transaction. Doing it ahead of writing wont change anything if writes happen back to back, but if there’s ever a pause it will only fail to do a full commit if a read operation is active for the full time of the last write plus the pause between writes.
When there are back-to-back writes and lots of reads, doing it ahead of writing wont help. Then we’d have to wait with the next write until a full checkpoint succeeds - could trigger this once an even higher threshold is met.
1 Like
maybe we are not talking about the same thing, I agree WAL can be any size and it is kind of ok.
but DB files grow;
folder.0010-kdrx2nvc.db was within 1GB initially.
then, it is 3.409.158.144
after 1.5 hours, it is 3.437.797.376
closer to the night, 4 hours later, it is 3.837.509.632 already
no files added here, nothing is happening
tomorrow we maybe see more, I will post more statistics
meanwhile, WAL is going from zero to gig and back which is as expected.
also, these two fellows cannot sync this for a day already,
which indicates I am facing not only GUI problem (which is mostly hang on both of these instances)
Please also accept a statement that I am not here for complains or like that. I can easily resolve all this just deleting DB altogether and rehashing into 1.30 or most probably even 2.0 will work OK from the scratch (not sure). Not a big deal. I am here writing trying to help develop a more stable solution.
I am not enabling debug logging now because there may be chances that stopping these instances will hide the problem. I am not sure how to proceed better. I may restart with more debug, but loose current state and chance to get traces of current situation. Your advice is welcomed.
ADDING: This is from one of the instances up to now, to compare runtime counters as it goes -
support-bundle-EBBXITJ-2025-09-05T222902.zip (764.2 KB)
Right, I wrongly only focused on the large WALs in the list you sent. I still don’t think it’s that great/normal that it grows so much, but if it is eventually/regularly resetting then that’s not a big issue at least. And anyway not the main issue you are pointing out, sorry.
I am not enabling debug logging now because there may be chances that stopping these instances will hide the problem. I am not sure how to proceed better. I may restart with more debug, but loose current state and chance to get traces of current situation. Your advice is welcomed.
No need to enable that debug logging, as WAL growth is not the main issue if an issue at all. Just for completeness: You could enable debug logging without restarting in the UI in the main menu: Actions > Logs.
Looking at goroutines/cpu pprof of the bundles, there seems to be a lot of activity, both syncing and indexes from remotes coming in and going out. Maybe the growth is just “normal” until that finishes. Not saying the DB size is “good” and can’t be optimized, I am also just trying to narrow down to things to actually improve. And don’t have anything useful on that at this point unfortunately.
1 Like
There is no activity in the folders, except once an hour, my watchdog writes kind of .touch to all of them, to ensure inotify trackers are online. Then I check API result for the “last update”. This is just my watchdog implementation to keep things secure. Single file per hour. No more.
No more changes in all of these reps which are under the issue. However, this may be just DB file fragmentation and maybe it just needs vacuuming, things will clarify in nearest days anyway.
Thanks for about logging, I am adding details and post if find something new to mention.