Ah in that case, you’ll instead have a much larger and equally compressible database in a year and three months, I guess. But you are demonstrating the golden scenario for why we shouldn’t remember deleted files forever.
Some (potentially very naïve/dumb) questions:
- as those deleted file/folder entries turn out to be very compressable, wouldn’t that imply that there are lots of duplicates involved?
- we need to keep the deleted entries for a while. But do we need all the infos or could we get away with a reduced set of attributes?
- could we clean up those entries earlier if all involved devices report back as up to date?
Can you run
PRAGMA index_info(‘SQLITE_AUTOINDEX_DEVICES_1’);
PRAGMA index_info(‘SQLITE_AUTOINDEX_KV_1’);
I am curious what fields it’s adding indexes for, as these tables should not need autoindexes.
sqlite> pragma index_list(kv);
seq  name                   unique  origin  partial
---  ---------------------  ------  ------  -------
0    sqlite_autoindex_kv_1  1       pk      0
sqlite> pragma index_info(sqlite_autoindex_kv_1);
seqno  cid  name
-----  ---  ----
0      0    key
sqlite> pragma index_list(devices);
seq  name                        unique  origin  partial
---  --------------------------  ------  ------  -------
0    sqlite_autoindex_devices_1  1       u       0
sqlite> pragma index_info(sqlite_autoindex_devices_1);
seqno  cid  name
-----  ---  ---------
0      1    device_id
My intepretation is that the first is the primary key index (origin=pk; because, I guess, it’s a rowid table) and the second is the unique on the device_id.
We can probably add a without rowid to the kv table, and the other one seems perfectly fine as-is.
(None of this has any practical consequence because the kv table holds, like, one or two entries most of the time.)
I am sorry to get into this chat. I’ve already created a bad ticket which was closed “wontfix”, I am sorry for that and appreciate your patience.
However, one more try here. Let me know if this annoys you and not helping and I will be silent for the future.
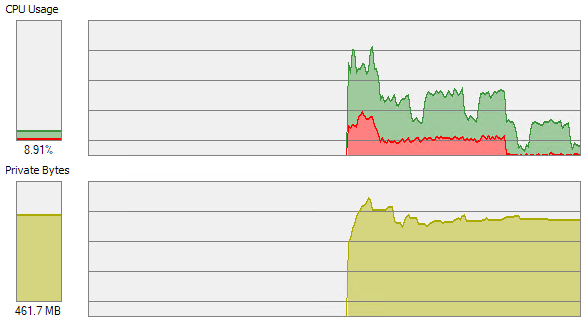
This is the following instance as an example: 1.2M files, 50K folders, 620GB data.
This screenshot is 1.20 version, and it is the startup of the instance, all initial scan done, and it is at idle as of now, it took about 10 minutes:
Now the same dataset on another machine, upgraded to 2.0.6, and this is not the first run - it is one of the runs after settling for a few days already, being at idle, then proper shutdown, etc.
Now see how it boots:
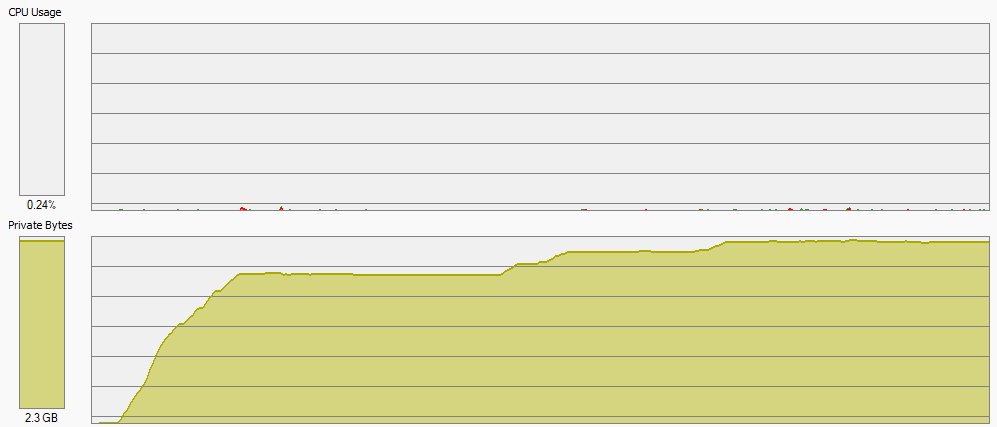
5x more time (already), will be 10x when initial scan done, 5x more memory usage (private bytes is approximately it’s active/resident memory set, actually, yes it is different, but here it is the same),
yes it will work when startup completes, and it even drops some memory (to ~1.2 gig approximately), but still, it is almost x2 compared to 1.20, as an example.
Can I help with providing debug details to help to track this all down? Or you consider it as expected, and I should just calm down and leave 2.0 (for me personally this probably mean downgrade).
I doubt this can be mitigated by kinds of page compression or whatever.
I appreciate great software and thanks your again for the patience.
This is the perfect place for that discussion and not annoying at all. I would like to ask for a support bundle / memory profile to begin with. It’s possible there are things that can be easily tuned, but it’s also possible it’s all in sqlite memory which is kind of opaque unfortunately.
The 2.0/sqlite stuff is somewhat in its infancy, tuning wise. The old database implementation had like 20 different knobs to tune various things, currently we just have some hardcoded defaults for sqlite. It’s possible we should decrease or increase cache sizes, number of concurrent “connections”, etc. for different scenarios.
It’s also quite possible that it will just use more memory than the old one did, because Syncthing by itself does much the same things as it always did but we now gain some sqlite overhead. That’s unfortunately a price we’ll have to pay in that case, because the old database engine was really end of life, unfortunately.
I do not think Syncthing should be using gigabytes of memory in an idle state while scanning, or idle, though, new or old database, effectively regardless of the amount of files being managed…
Edit: make sure it is 2.0.6 though and not 2.0.5 or earlier, because there was a migration bug…
1 Like
When initial startup done, things are reasonable, I agree that we can live with x2, no doubt. Yes a regression but for reasons, okay with that.
But during this initial startup, API and GUI are unresponsive. It can be maybe some one refresh every few minutes. So it seems that I cannot generate profiling during this startup phase, already tried that and keep trying, but as of now I fail. I keep trying still. I will upload when succeed.
Is Support Bundle is safe to share? I have sensitive folders in sync.
UPD: yes it is 2.0.6, I was not trying anything earlier. Upgrade path was ~1.30 → 2.0.6, all went smooth, at many of my instances.
There’s a bug in the support bundle that it includes passwords for encrypted folders; a fix was committed literally minutes ago. Otherwise it’s a bunch of profiles, the redacted config, and some logs.
But if that’s hard to reach (which is interesting! something more than just sqlite memory is going on!) you can hit the profiling endpoints directly at https://localhost:8384/rest/debug/heapprof and https://localhost:8384/rest/debug/cpuprof
1 Like
@calmh the files table could probably be shrinked, judging from a small sample of my DB:
| device_idx | sequence | remote_sequence | name | type | modified | size | version | deleted | local_flags | blocklist_hash |
|---|---|---|---|---|---|---|---|---|---|---|
| 1 | 816 | Wallpaper/001 - Dh2OrWE.jpg | 0 | 1493926137360000000 | 73627 | 541c2f0d72043ac6:1,5c3011434456b726:1594411867,5facc97fa26f2878:1,6cd881fea41b096e:1640295753,de188f93a2c1e691:1 | 0 | 16 | ��\u0003�俘�\u000f����H���WeT�\u001d�es\u001bx����/ | |
| 5 | 7913 | 16433 | Wallpaper/001 - Dh2OrWE.jpg | 0 | 1493926137360000000 | 73627 | 541c2f0d72043ac6:1,5c3011434456b726:1594411867,5facc97fa26f2878:1,6cd881fea41b096e:1640295753,de188f93a2c1e691:1 | 0 | 0 | ��\u0003�俘�\u000f����H���WeT�\u001d�es\u001bx����/ |
| 360 | 10346 | 1060 | Wallpaper/001 - Dh2OrWE.jpg | 0 | 1493926137360000000 | 73627 | 541c2f0d72043ac6:1,5c3011434456b726:1594411867,5facc97fa26f2878:1,6cd881fea41b096e:1640295753,de188f93a2c1e691:1 | 0 | 0 | ��\u0003�俘�\u000f����H���WeT�\u001d�es\u001bx����/ |
| 1 | 583 | Wallpaper/002 - cp3igrX.jpg | 0 | 1493926164730000000 | 285697 | 541c2f0d72043ac6:1,5c3011434456b726:1594411867,5facc97fa26f2878:1,6cd881fea41b096e:1640295753,de188f93a2c1e691:1 | 0 | 16 | 1��;��X�1\�p�\u0017z5�y�\u000bk��=�=��9��2 | |
| 5 | 7914 | 16434 | Wallpaper/002 - cp3igrX.jpg | 0 | 1493926164730000000 | 285697 | 541c2f0d72043ac6:1,5c3011434456b726:1594411867,5facc97fa26f2878:1,6cd881fea41b096e:1640295753,de188f93a2c1e691:1 | 0 | 0 | 1��;��X�1\�p�\u0017z5�y�\u000bk��=�=��9��2 |
| 360 | 9989 | 702 | Wallpaper/002 - cp3igrX.jpg | 0 | 1493926164730000000 | 285697 | 541c2f0d72043ac6:1,5c3011434456b726:1594411867,5facc97fa26f2878:1,6cd881fea41b096e:1640295753,de188f93a2c1e691:1 | 0 | 0 | 1��;��X�1\�p�\u0017z5�y�\u000bk��=�=��9��2 |
| 1 | 957 | Wallpaper/003 - HMr1eZw.jpg | 0 | 1493925567300000000 | 287404 | 541c2f0d72043ac6:1,5c3011434456b726:1594411867,5facc97fa26f2878:1,6cd881fea41b096e:1640295753,de188f93a2c1e691:1 | 0 | 16 | п�\u001c��F’�HN�����*��\u0018w��Y�����д | |
| 5 | 7915 | 16435 | Wallpaper/003 - HMr1eZw.jpg | 0 | 1493925567300000000 | 287404 | 541c2f0d72043ac6:1,5c3011434456b726:1594411867,5facc97fa26f2878:1,6cd881fea41b096e:1640295753,de188f93a2c1e691:1 | 0 | 0 | п�\u001c��F’�HN�����*��\u0018w��Y�����д |
| 360 | 10506 | 1220 | Wallpaper/003 - HMr1eZw.jpg | 0 | 1493925567300000000 | 287404 | 541c2f0d72043ac6:1,5c3011434456b726:1594411867,5facc97fa26f2878:1,6cd881fea41b096e:1640295753,de188f93a2c1e691:1 | 0 | 0 | п�\u001c��F’�HN�����*��\u0018w��Y�����д |
The rows share quite a few larger fields. Maybe it’s worth to normalize the schema further here.
@bt90 patches and benchmarks 
1 Like
support-bundle-EBBXITJ-2025-09-04T212549.zip (374.7 KB)
That’s in the middle of this struggle to start, but, around capturing this, some long operation seems completed, so,
- memory usage dropped 3G → ~2G, and
- it had some chance to act, and generated the bundle.
so it is not the snapshot of the worst situation, but still, close to.
(after that, it went doing something next and blocked for another 5 minutes)
You should still be able to follow the instructions from https://docs.syncthing.net/users/profiling even if the GUI is unresponsive.
There are multiple files in the bundle. Out of those,
config.json.txtcontains device IDs, device and folders names, paths, etc.connection-stats.json.txtcontains device IDs (not really sensitive but I don’t like sharing them in full)log-inmemory.txtandlog-ondisk.txtcontain all of the above plus IP addresses and a lot of folder and file paths on the disk (probably the most sensitive)metrics.txtcontains folder names and pathsusage-reporting.json.txtandversion-platform.json.txtare safe to share- all *.pprof files are safe to share (at least as far as I’m aware)
2 Likes
Thanks for clarification on bundle privacy, I’ve reviewed the data and I found a lot private there indeed, but OK for me to share.
Now it is
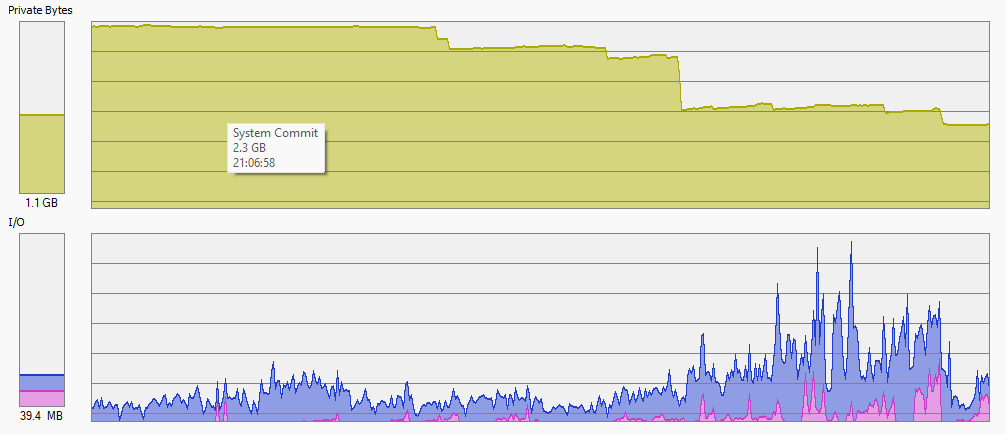
This is an example of how it ends and settles to idle.
(I will keep trying to capture worst startup phase)
My first suggestion from just a glance at the profiles would be set a folder concurrency limit. At least some of your peak memory usage will come from the fact that you have 20+ folders and they’re all scanning at the same time. Along those same lines, if the database is on slow I/O for any reason, that’ll be a killer with all the seeks etc going on.
Hmm wait you do have that set to four… ah yes, my bad, they show up as scanning in the trace but are actually paused waiting for their turn. Ignore that for now.
Yes, initially, I was running with folder concurrency limit 1, and also, with GOMAXPROCS=1, to keep resource usage down.
When upgraded to 2.0.6, I started trying to change things, to find that maybe I can get it start faster, and now it is with concurrency 4 and GOMAXPROCS~=CPU count,
It just does not change anything meaningful, yes I can have this struggle startup at full throttle or slower, but in any case something is wrong here.
EDIT 1:
Cannot post a new message due to new user limitation, so adding here:
I also have a much worse situation actually with another mesh of instances, were I do have 10M files for 4TB, there the settled memory usage is like x4 compared to 1.30.
But I will avoid debugging it for now because it is corporate, (and I also I have terabytes of RAM there so does not matter)
EDIT 2:
This memory is highly resident. If I trim working set, it comes back very fast. This means that if it is the page cache of DB, then, some full scans involved.
Yeah. Anyway, from the memory profile,

That’s the Go (application) heap, the rest will be SQLite stuff in this case.  I suspect page caches for the 20-something individual folder databases.
default cache_size of SQLite is very conservative, kind of for embedded systems… do you increase it to something like infinite?
Anyway, maybe if we have real DB now, we need all these knobs into Advanced settings… maybe even including custom pragmas, at least for really advanced cases.
2 Likes
We increase it a fair amount. I just kicked off a build to set it back to the (indeed conservative) SQLite default, figured you could take that for a spin just to see what happens. I don’t expect any performance improvement, but if memory use is drastically reduced that at least points to the source.
And yes, probably we should add a bunch of settings for these things.
2 Likes
thanks, will try this version once win binary available
EDIT: trying…
2 Likes