So I have a few questions with the metrics if someone can help me.
Is the only way to tell that a folder is “out of sync” that the need bytes > 0? I guess this doesn’t work if there are items that still need to be deleted because need bytes could be 0 but those files aren’t deleted. I can’t find a folder state that is exactly equivalent to “Out of Sync”.
What exactly is a “folder pull”? This counter seems to increase when a sync starts. Aside from tracking the state change is there any benefit to visualizing folder pulls? How would a visualization help you?
It would be nice if we could get a property in the device info that shows the last epoch time that the device was seen. This could be useful for alerting mostly so we don’t have to mine the “syncthing_connections_active” history to find the last time the value was non zero.
There seems to be nothing in the metrics that indicates the “state” of a “device”. We can find out if they are paused in the device info. We can find out if they are connected and how many connections they have. But there’s no such thing as a “device state” metric that would indicate if it’s up to date, out of date, or syncing. We can only tell syncing is ongoing by looking at the network traffic. Seems there could be a device state like there is a folder state.
Is there any value in visualizing events? There are many event types. Why should I care about them? I guess it could be possible to determine connects and disconnects by monitoring these events but these are of limited value because they’re only counters that are not tied to devices connecting or disconnecting. I’m just wondering if there’s some other value in visualizing the events. Maybe event triggers can be useful for alerting? Is there a list of events and their meanings? There are a number of events that seem to be “created” that aren’t “delivered”, and a number of events that are created and delivered many times. I guess it’s more interesting to see events created. But I’m not sure. (It’s true, I don’t understand the event mechanism.)
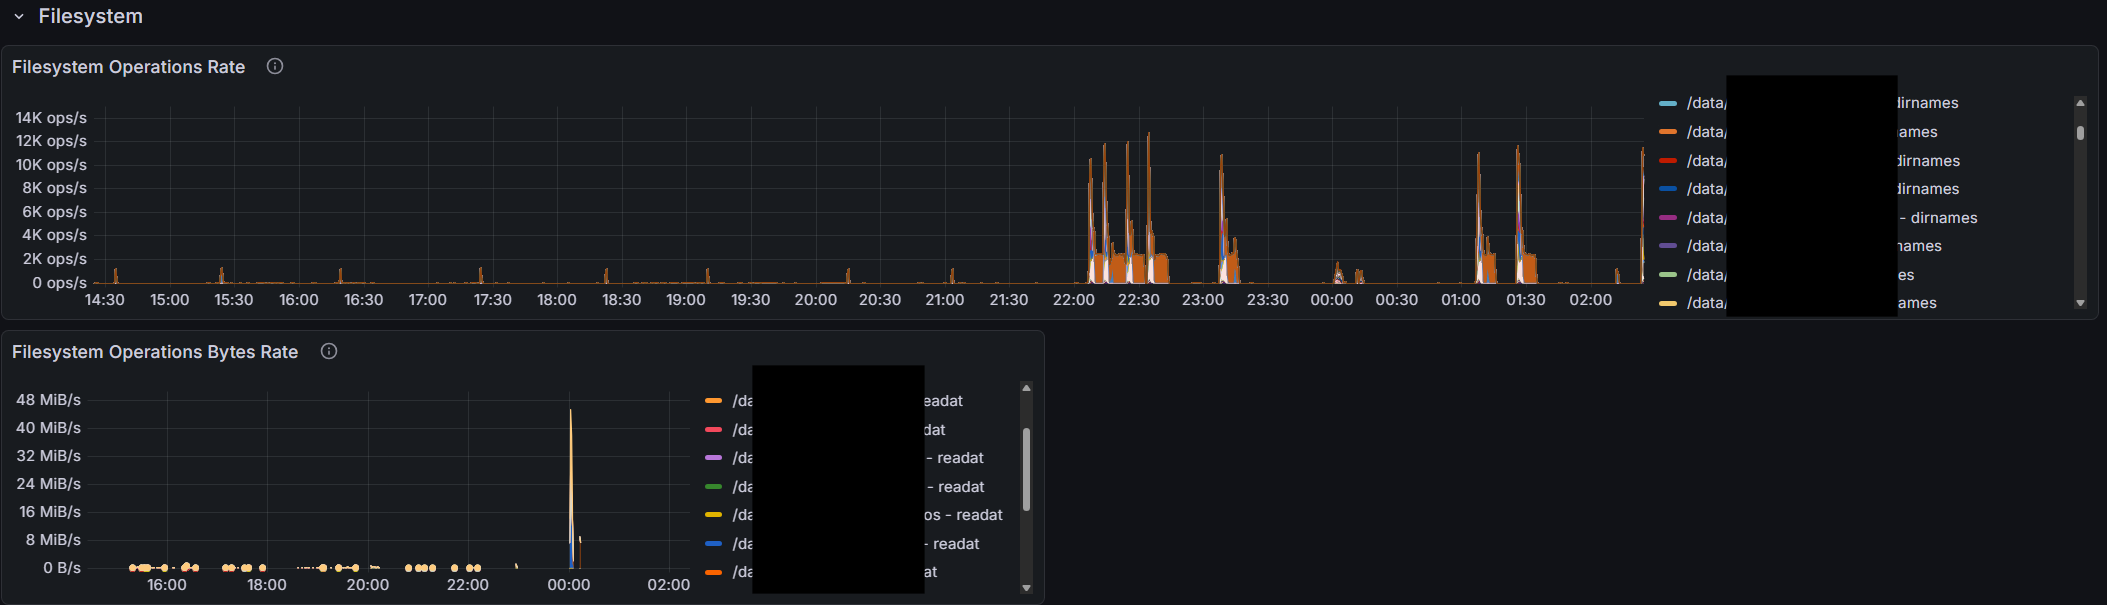
There are a ton of “timing” metrics, fs_operations_seconds and db_operations_seconds. Not sure what to make of these in terms of charting them meaningfully. This is probably debug stuff, but if if makes sense to show something of interest here, please explain.
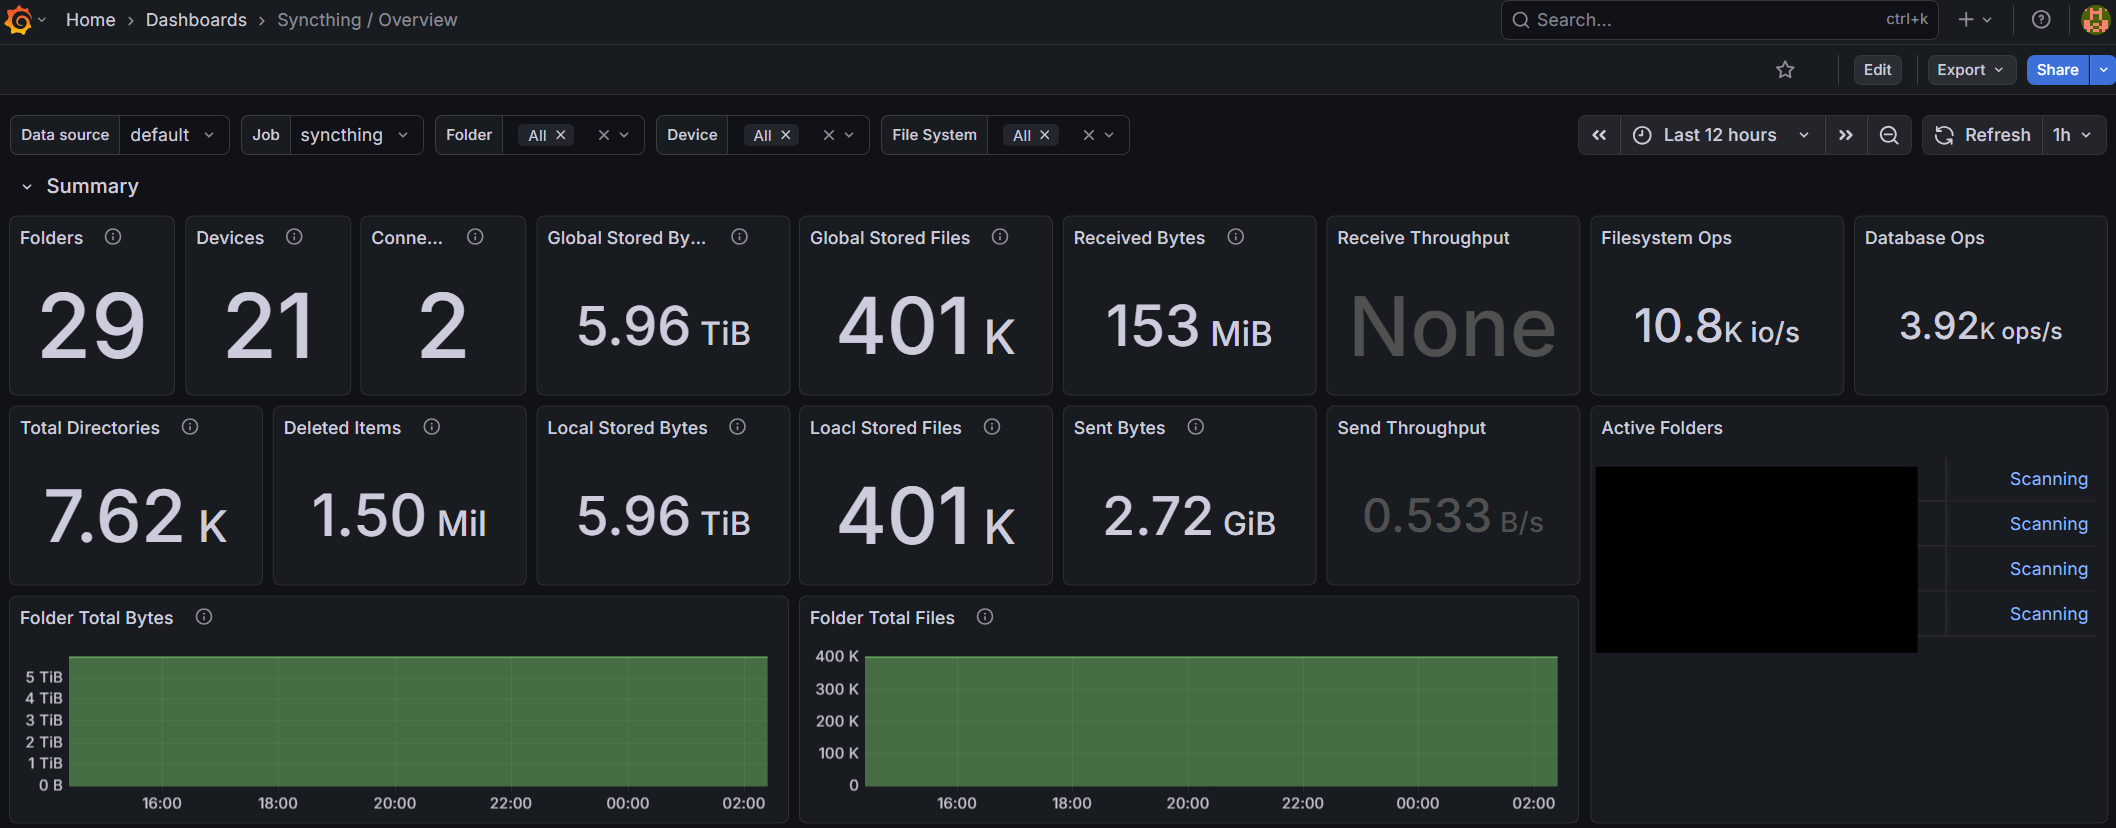
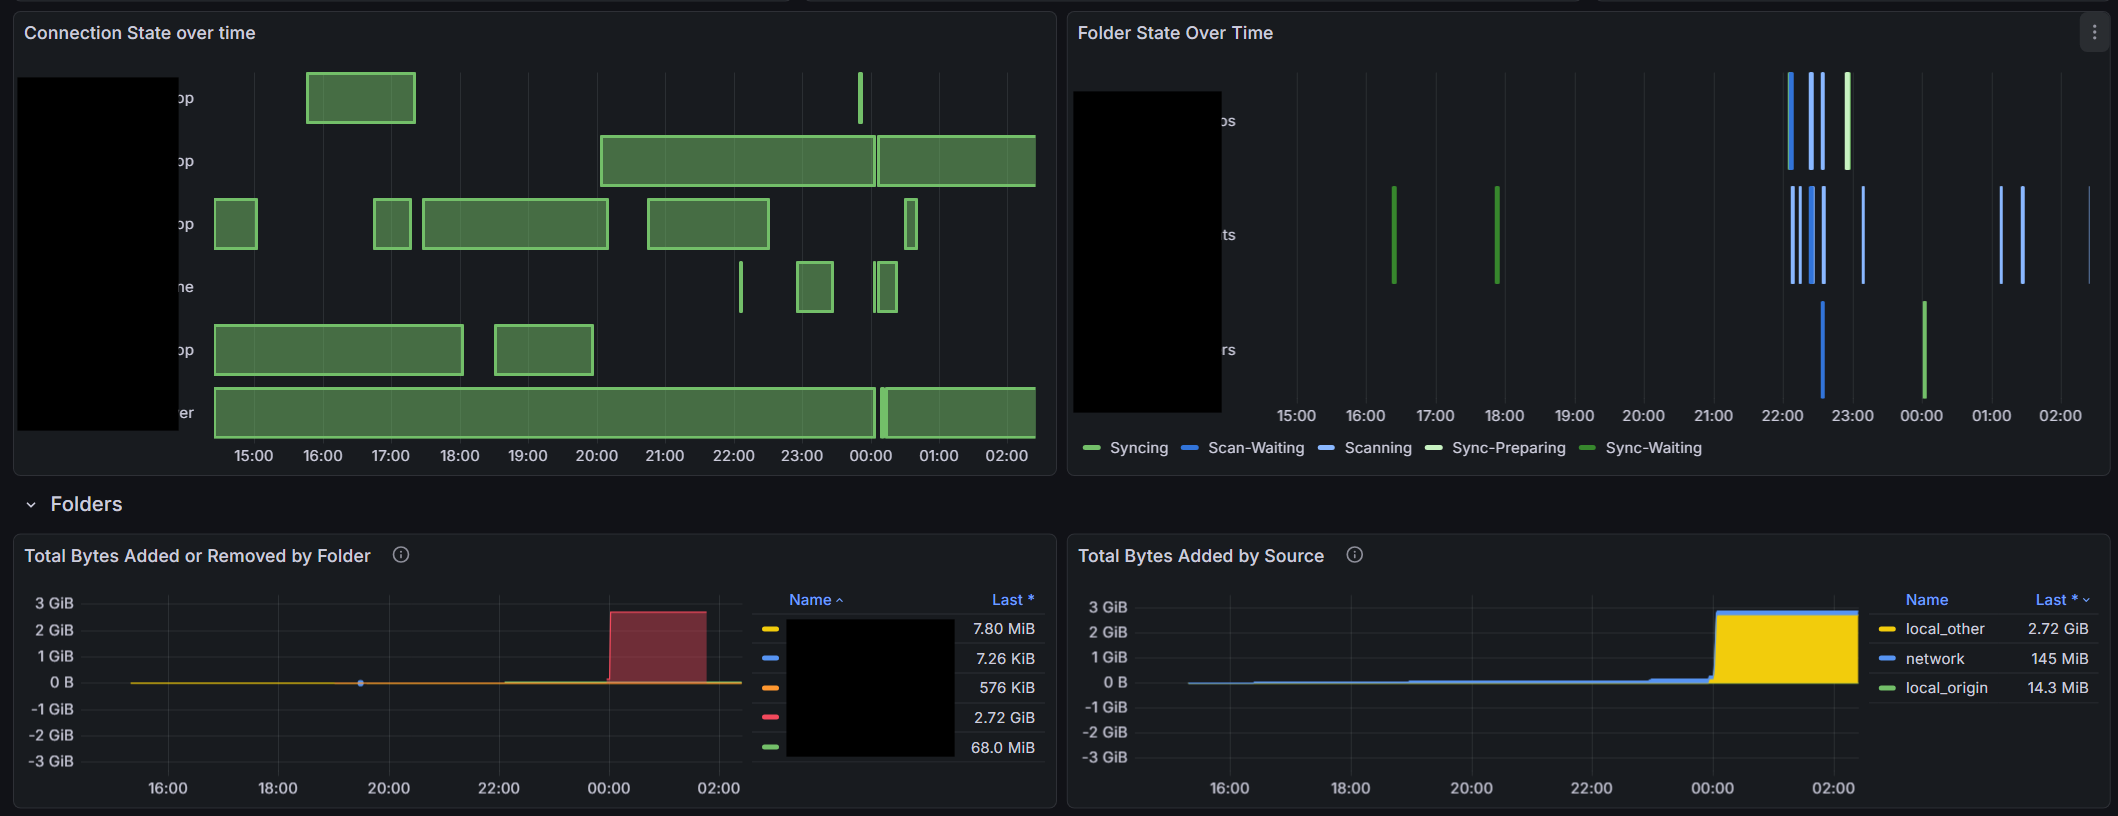
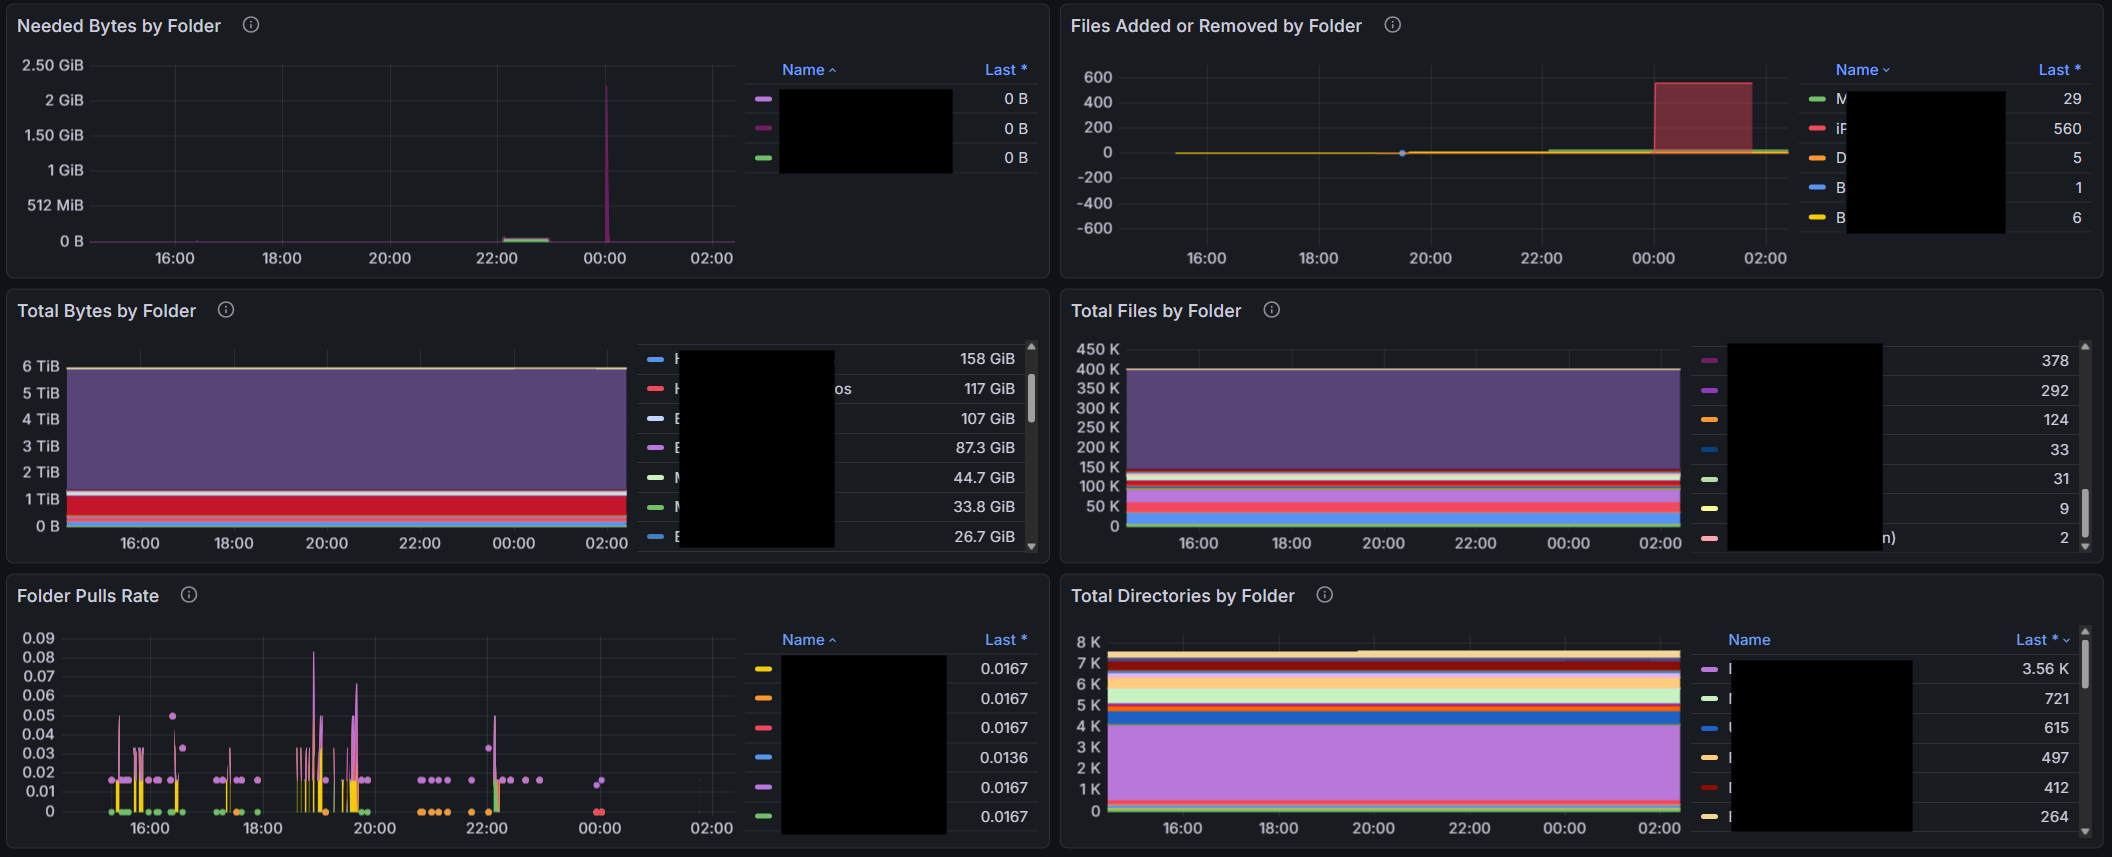
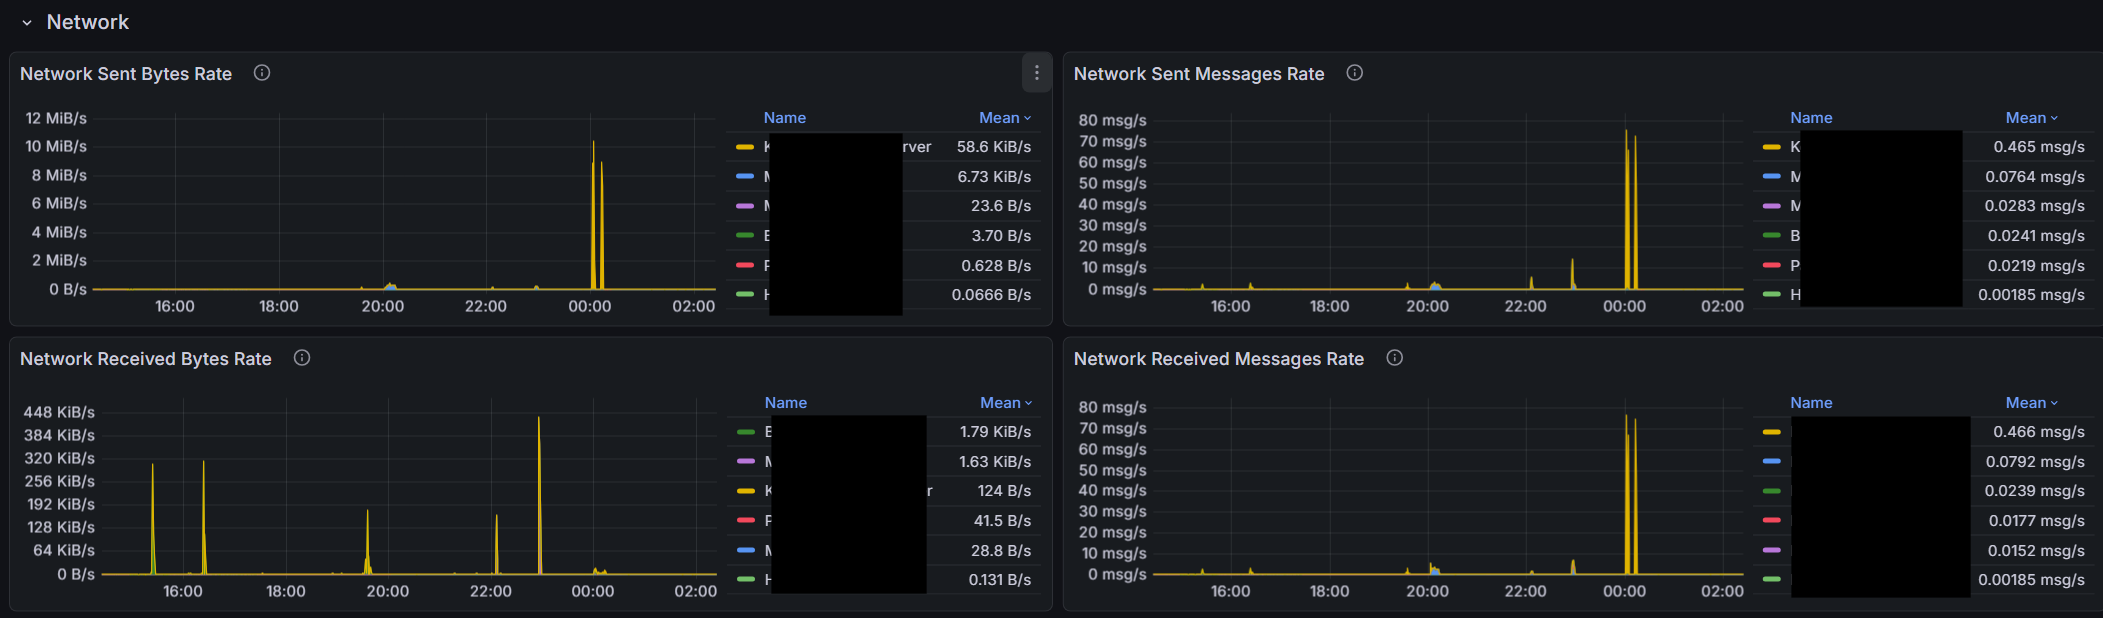
Ok here’s what it currently looks like: