I’m sure there are people here that have setup monitoring and/or alerting using prometheus and the http://syncthing/metrics exposed. Anyone have a grafana dashboard they are using and would like to share? I found one here, but there are some implementation issues.
I’m trying to clean some of them up and make more useful charts. I’m curious if others have set something up they like. Care to share the .JSON?
Would it make sense to provide a sample grafana dashboard that uses most of the metrics as a sample inside the github somewhere? If I get to a point where I have a solid dashboard I could try to figure out how to do a PR if there’s interest.
Anyway if someone has a grafana JSON they want to share, or a set of prometheus alert definitions, I’d love to see what you guys have created.
Okay so there are a ton of implementation issues with that dashboard. I’m cleaning stuff up little by little. I do think there are decent metrics to make a useful dashboard.
Note I believe there were additions to the metrics in version 1.3. The dashboard will be incompatible with metrics before v1.3 (though I’m on 2.13 now.)
So I have a few questions with the metrics if someone can help me.
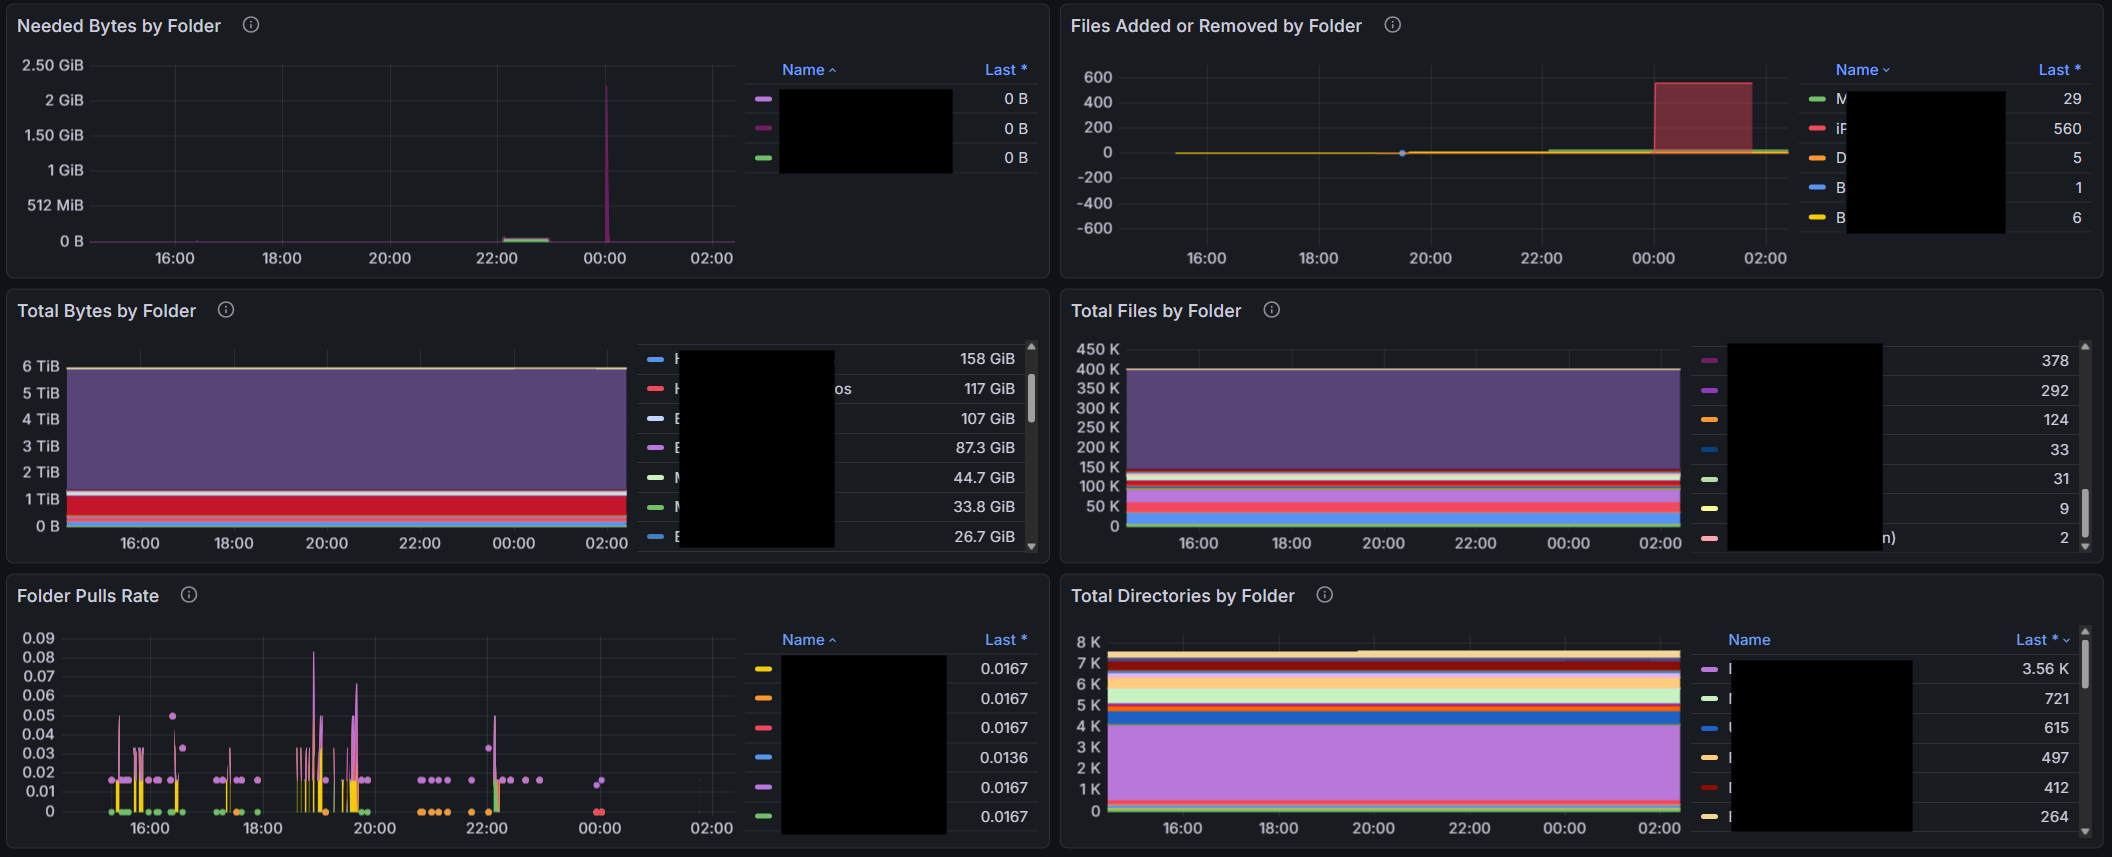
Is the only way to tell that a folder is “out of sync” that the need bytes > 0? I guess this doesn’t work if there are items that still need to be deleted because need bytes could be 0 but those files aren’t deleted. I can’t find a folder state that is exactly equivalent to “Out of Sync”.
What exactly is a “folder pull”? This counter seems to increase when a sync starts. Aside from tracking the state change is there any benefit to visualizing folder pulls? How would a visualization help you?
It would be nice if we could get a property in the device info that shows the last epoch time that the device was seen. This could be useful for alerting mostly so we don’t have to mine the “syncthing_connections_active” history to find the last time the value was non zero.
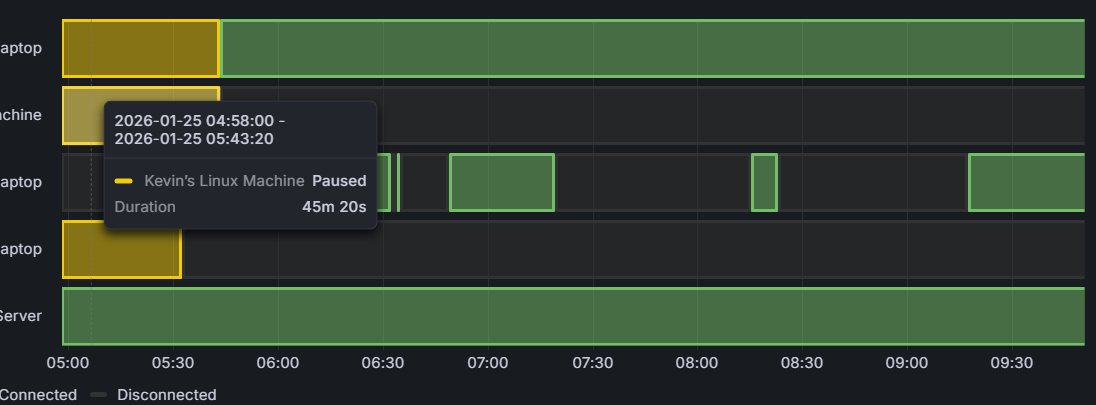
There seems to be nothing in the metrics that indicates the “state” of a “device”. We can find out if they are paused in the device info. We can find out if they are connected and how many connections they have. But there’s no such thing as a “device state” metric that would indicate if it’s up to date, out of date, or syncing. We can only tell syncing is ongoing by looking at the network traffic. Seems there could be a device state like there is a folder state.
Is there any value in visualizing events? There are many event types. Why should I care about them? I guess it could be possible to determine connects and disconnects by monitoring these events but these are of limited value because they’re only counters that are not tied to devices connecting or disconnecting. I’m just wondering if there’s some other value in visualizing the events. Maybe event triggers can be useful for alerting? Is there a list of events and their meanings? There are a number of events that seem to be “created” that aren’t “delivered”, and a number of events that are created and delivered many times. I guess it’s more interesting to see events created. But I’m not sure. (It’s true, I don’t understand the event mechanism.)
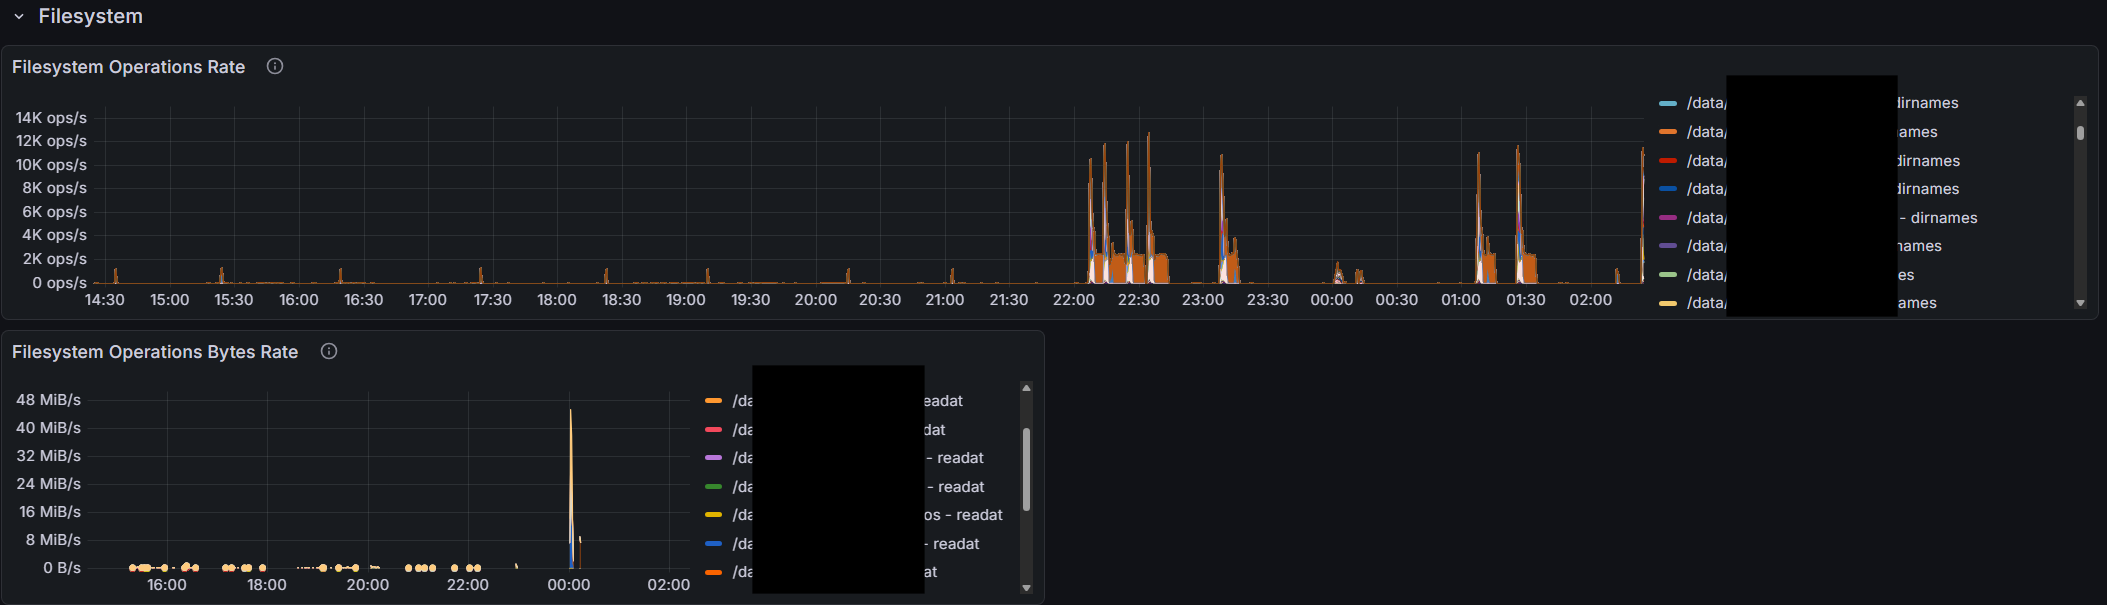
There are a ton of “timing” metrics, fs_operations_seconds and db_operations_seconds. Not sure what to make of these in terms of charting them meaningfully. This is probably debug stuff, but if if makes sense to show something of interest here, please explain.
I monitor my Syncthing cluster using API calls to /rest/system/connections, /rest/stats/device, and /rest/db/completion. That gives me Device state, the last time a Device it was seen, and also whether the Folders are Up to Date. I’m far from expert on Graphana but I thought it used the APIs to pull the data it visualizes. Would the first two work for your use case?
That data would be great and would solve a lot of the issues, but it’s not available via the prometheus metrics. To see all the stuff I have access to for this dashboard, go to:
Grafana queries Prometheus. Prometheus scrapes the metrics and stores them in it’s database which is highly optimized for time-series data.
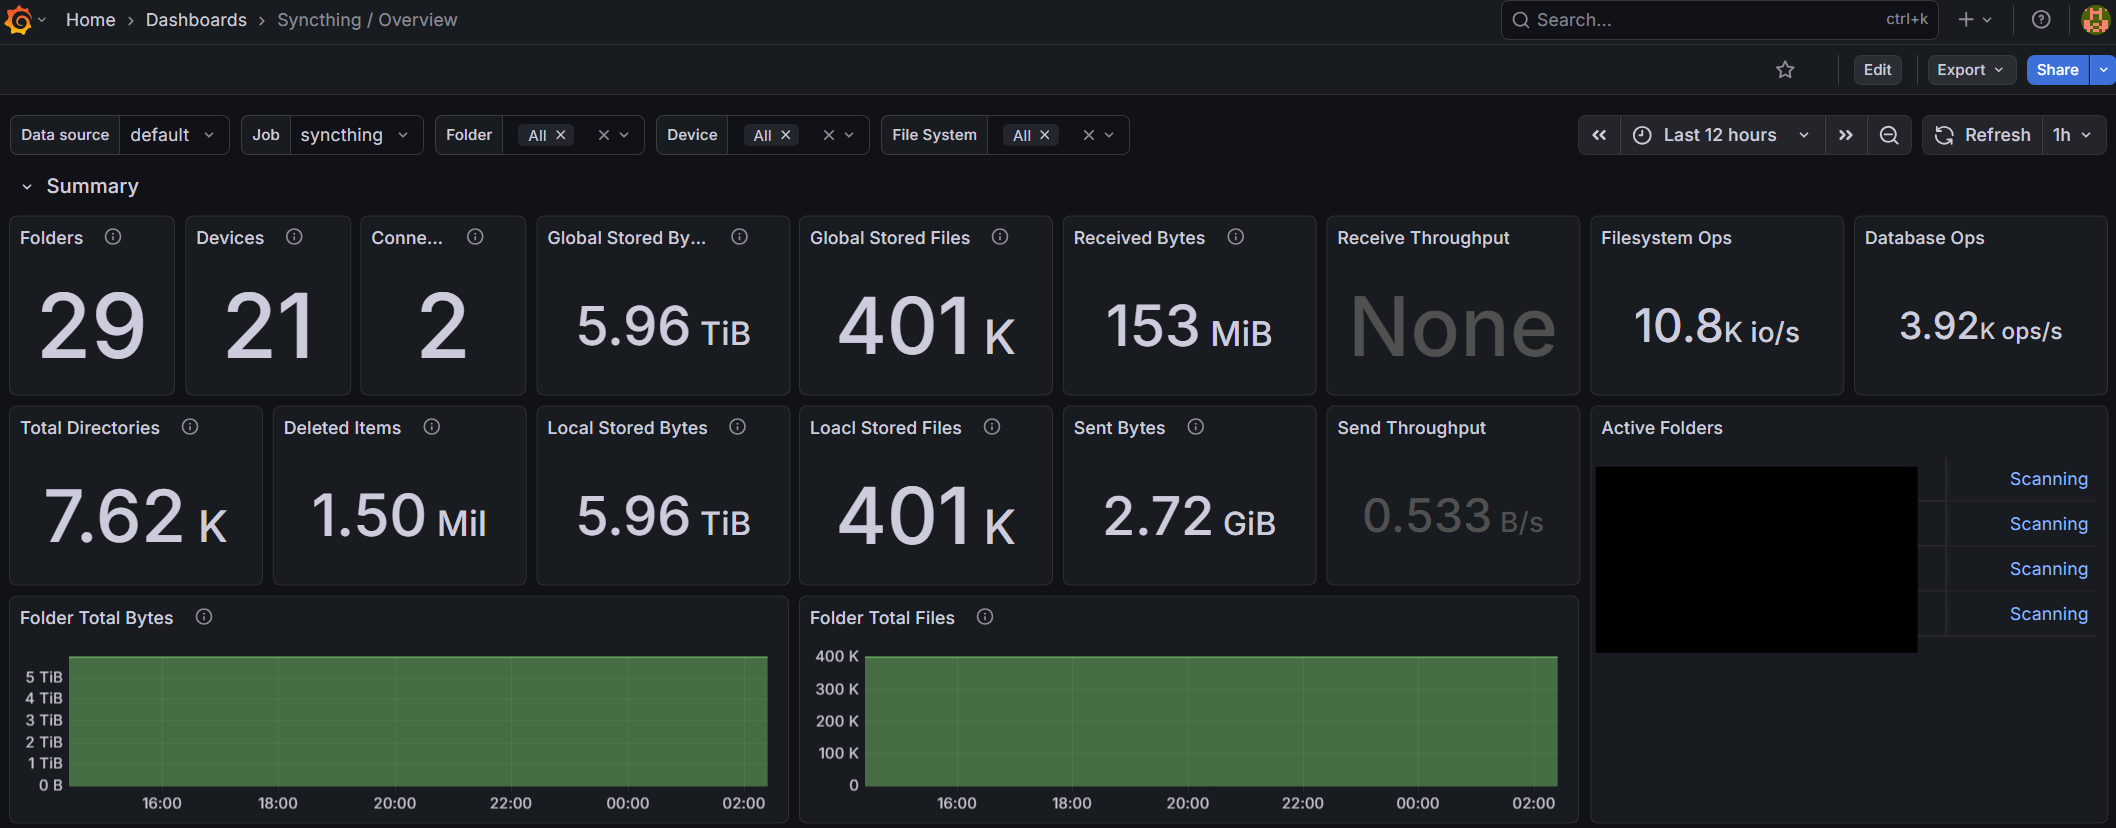
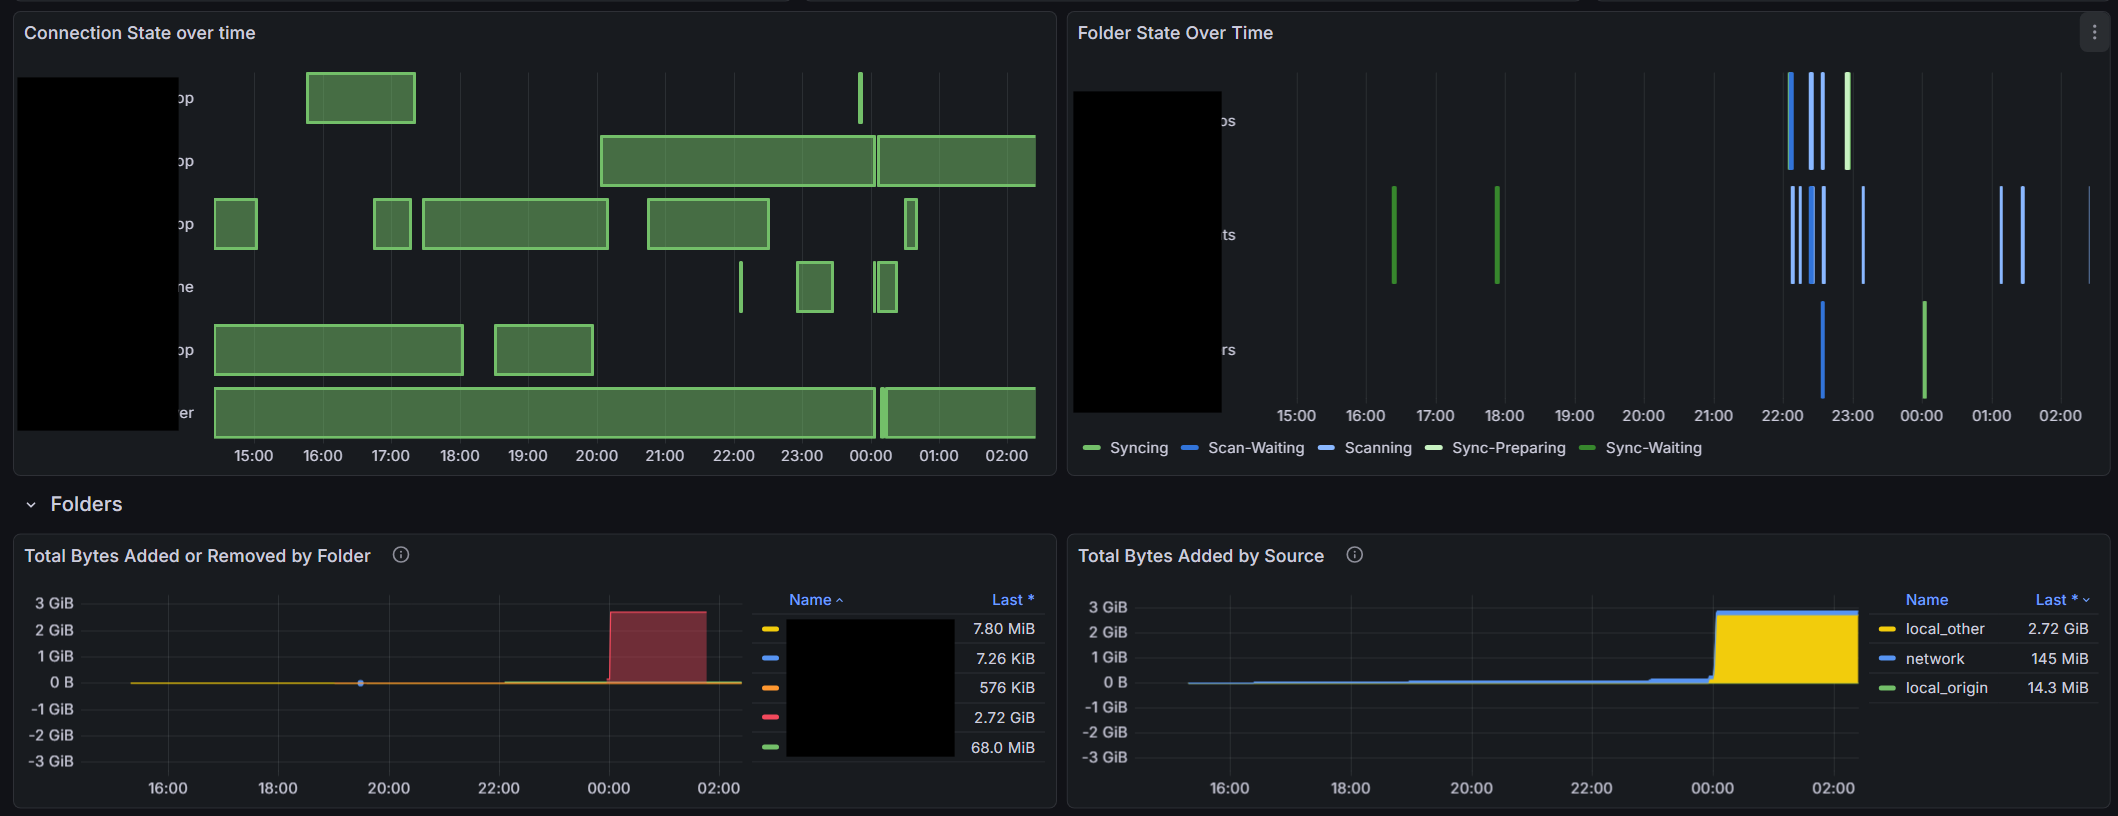
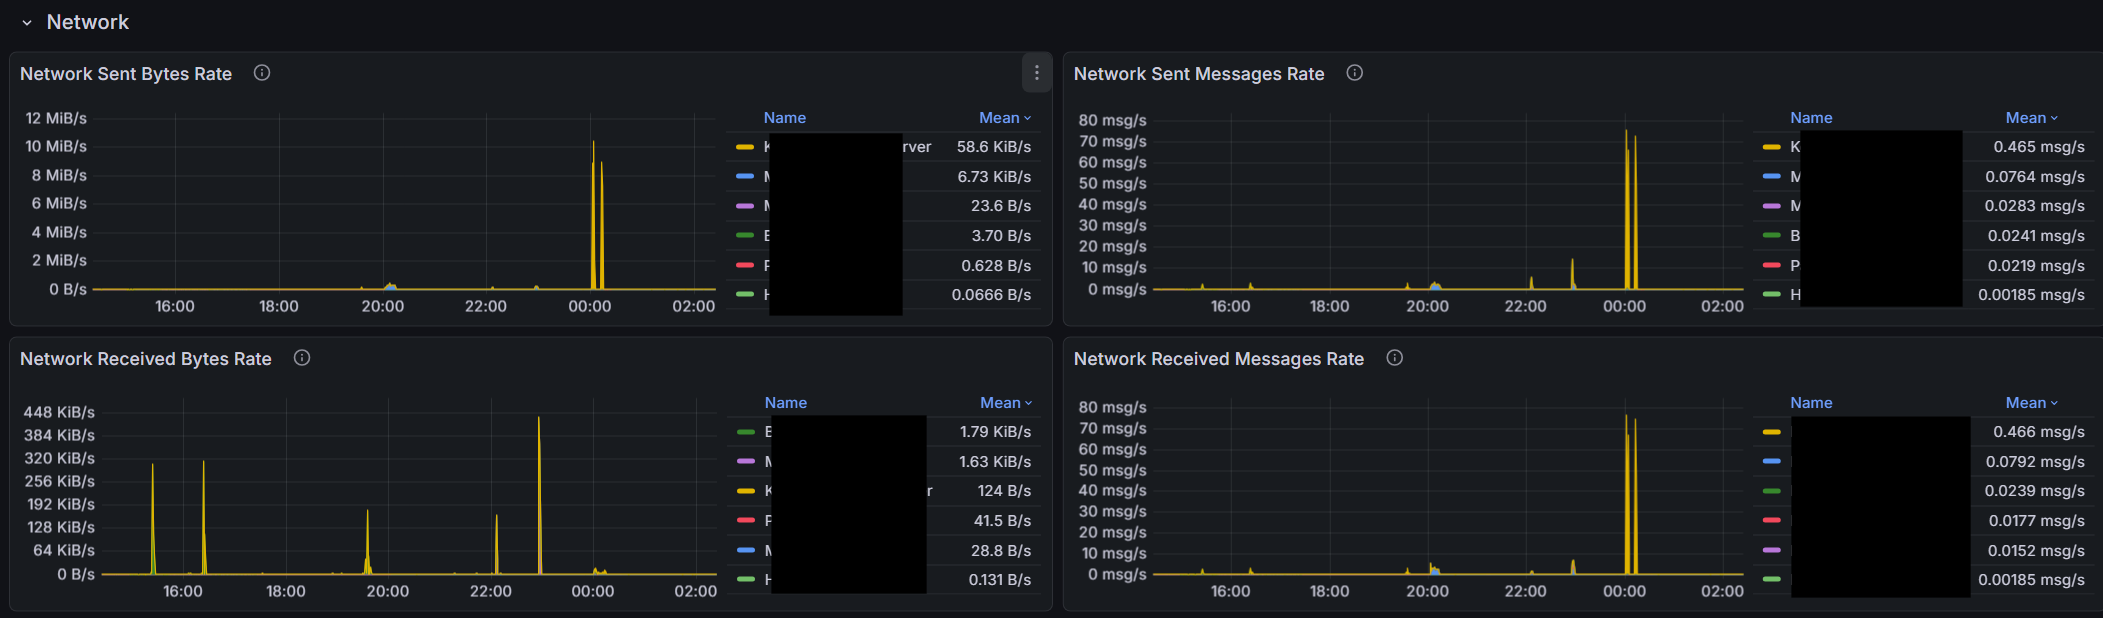
The grafana dashboard is basically a bunch of visualizations, which each have an underlying prometheus query. You set a time period and optional filters, and basically grafana says to Prometheus, “Hey give me the connection status for all the devices at 15 second intervals over the last 6 hours” and Grafana takes the data and produces a visualization that looks like this:
This is all setup already. syncthing.yourdomain/metrics is already returning a bunch of useful data (and a bunch of perhaps not so useful data). But there are some gaps in what it’s reporting. and I’m wondering if I’m missing anything, or if someone could take up an effort to add some more of the metrics.
I’m happy to do the grafana stuff. I’m starting to get good at it. But the Go stuff I can’t help with unfortunately.
I would be comfortable calling them every five minutes without any testing whatsoever — as far as I can tell, the API calls I use do not impact performance on my one Mac or two Win11 Devices.
But in production, my tests run every twelve hours. I wake up, and end my work day with a report that all is well, or an alert that it isn’t. For my home setup, that works well for me.
Okay. Thanks. Currently I’m scraping /metrics at 15 second intervals so I have a better chance of capturing quicker sync events. I may pull the latest code and see if I can figure out how it works. I’m not really familiar with Go.
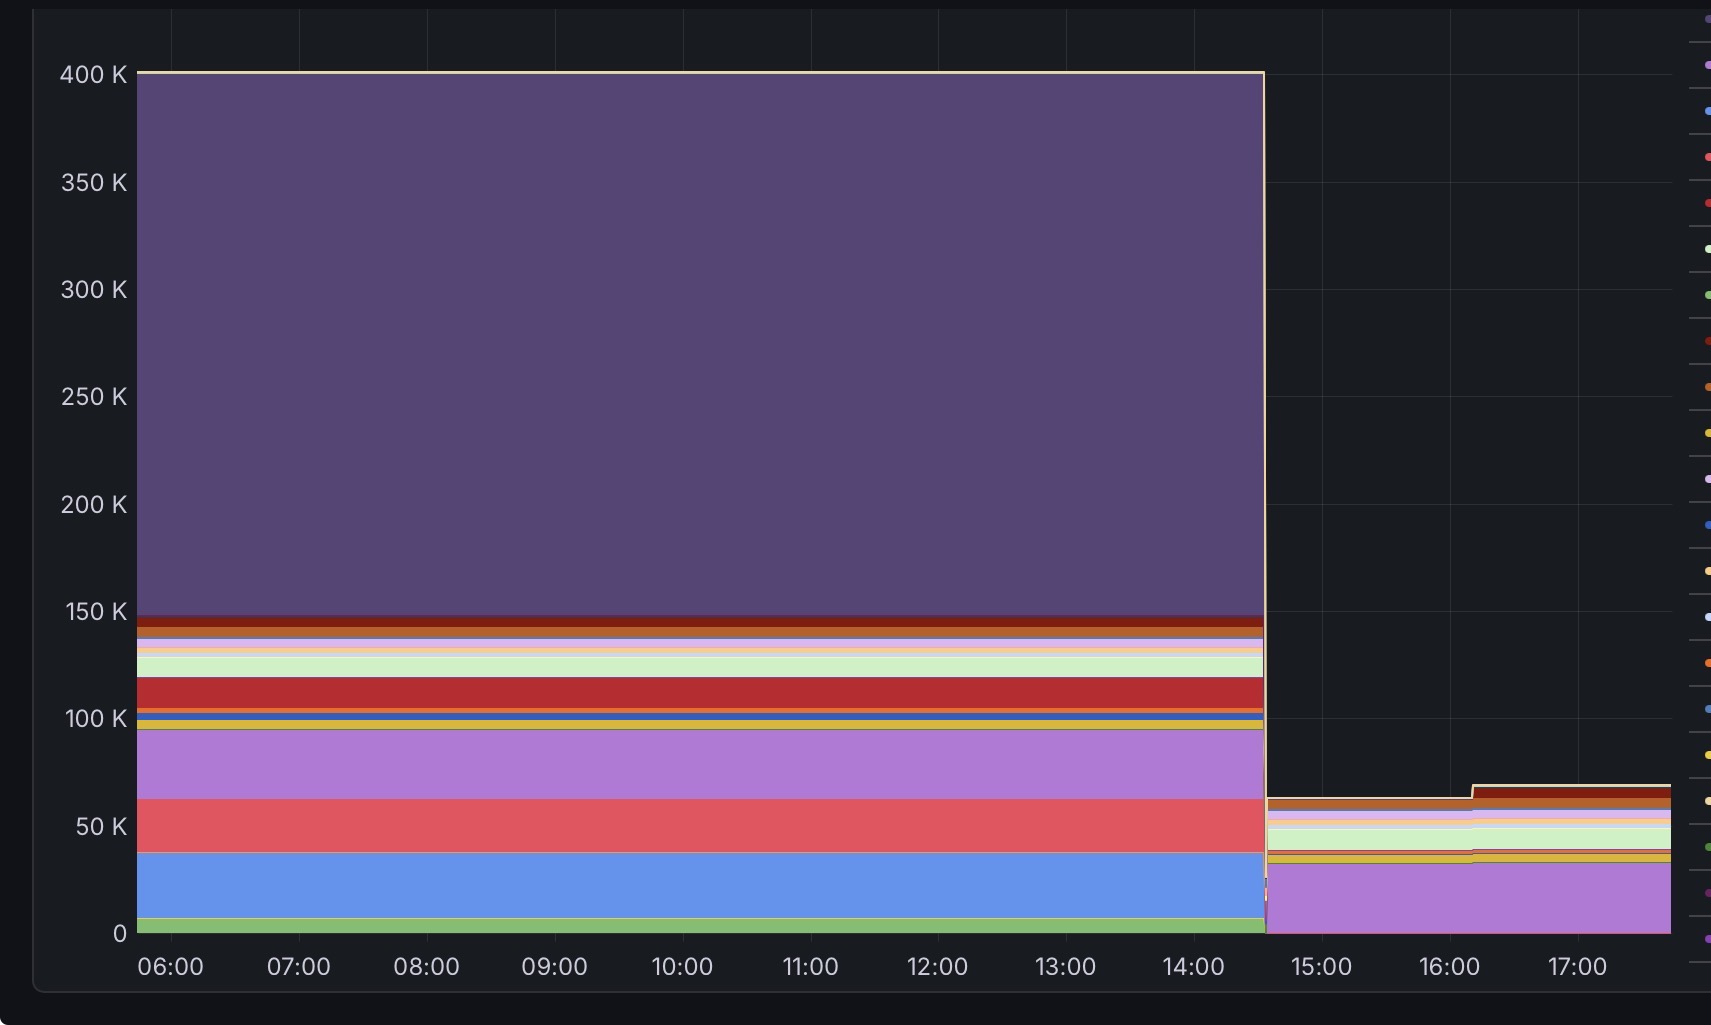
incidentally I did restart my instance and metrics isn’t reporting some folders after the restart. It seems it needs a connection to a device that cares about a folder (or a rescan that results in a change to the folder) before sync thing starts reporting metrics after a restart. I first noticed this after upgrading to 2.0 (.13 actually) but figured it was some weird artifact of the database conversion, but it isn’t…
Any of the developers have any idea why? The restart is done where the file count instantaneously goes to zero, which is fine. But I expected the filecount to return to the actual value after all the rescans finished, but they didn’t (rescans took 10 mins) one device connected an hour later and you can see two additional folders suddenly were added to the metrics.