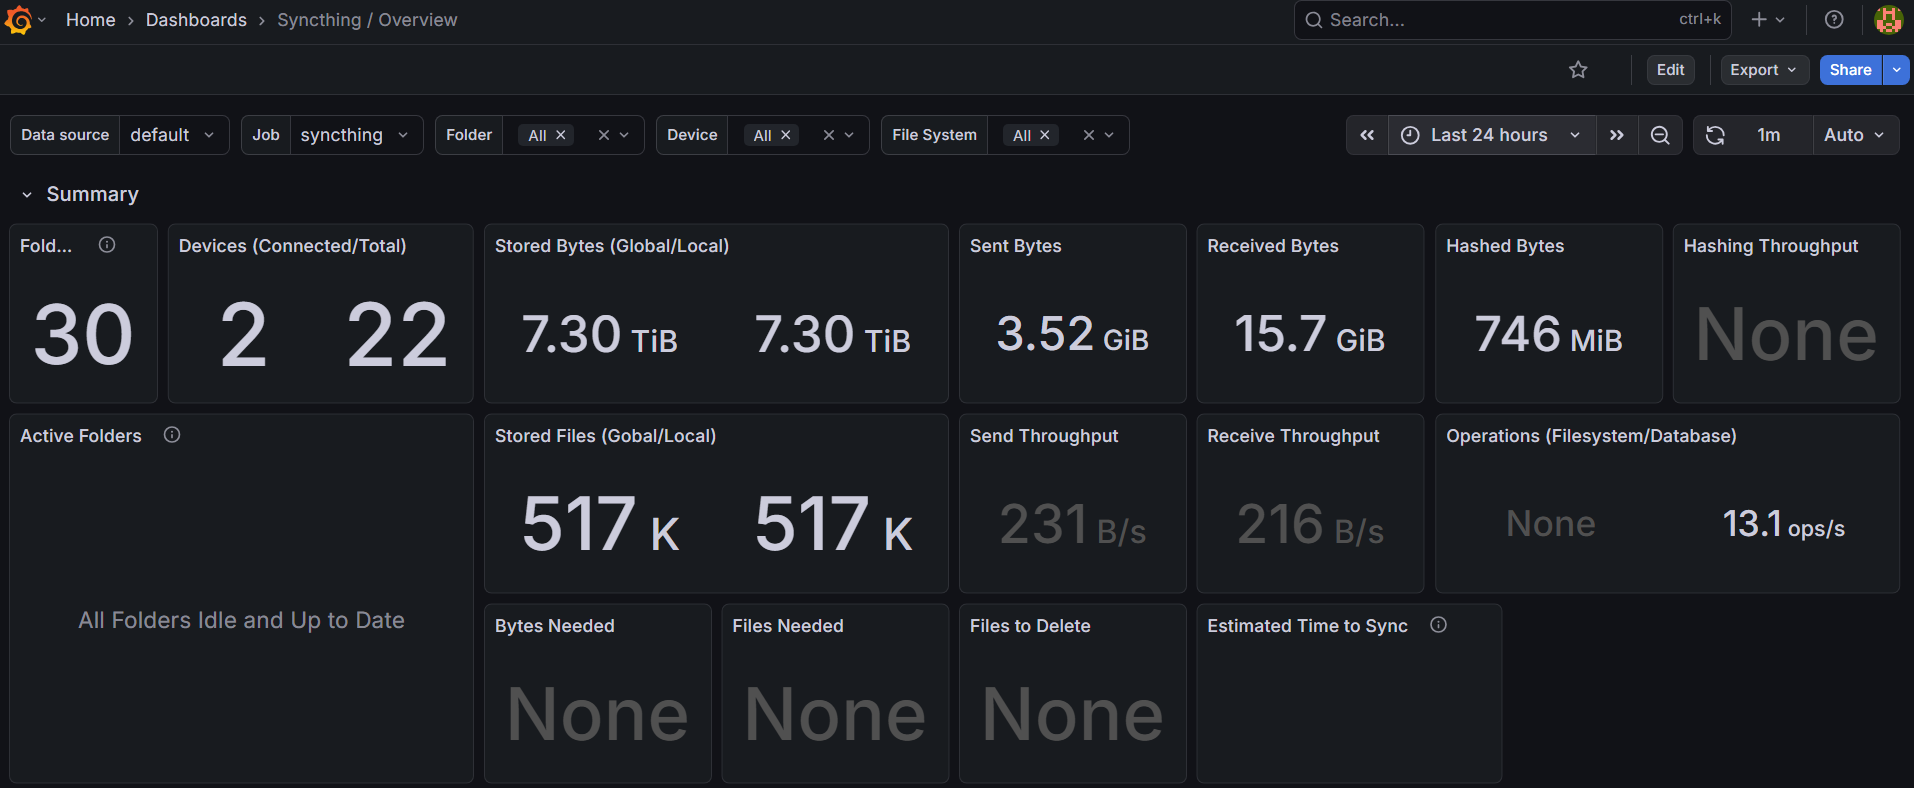
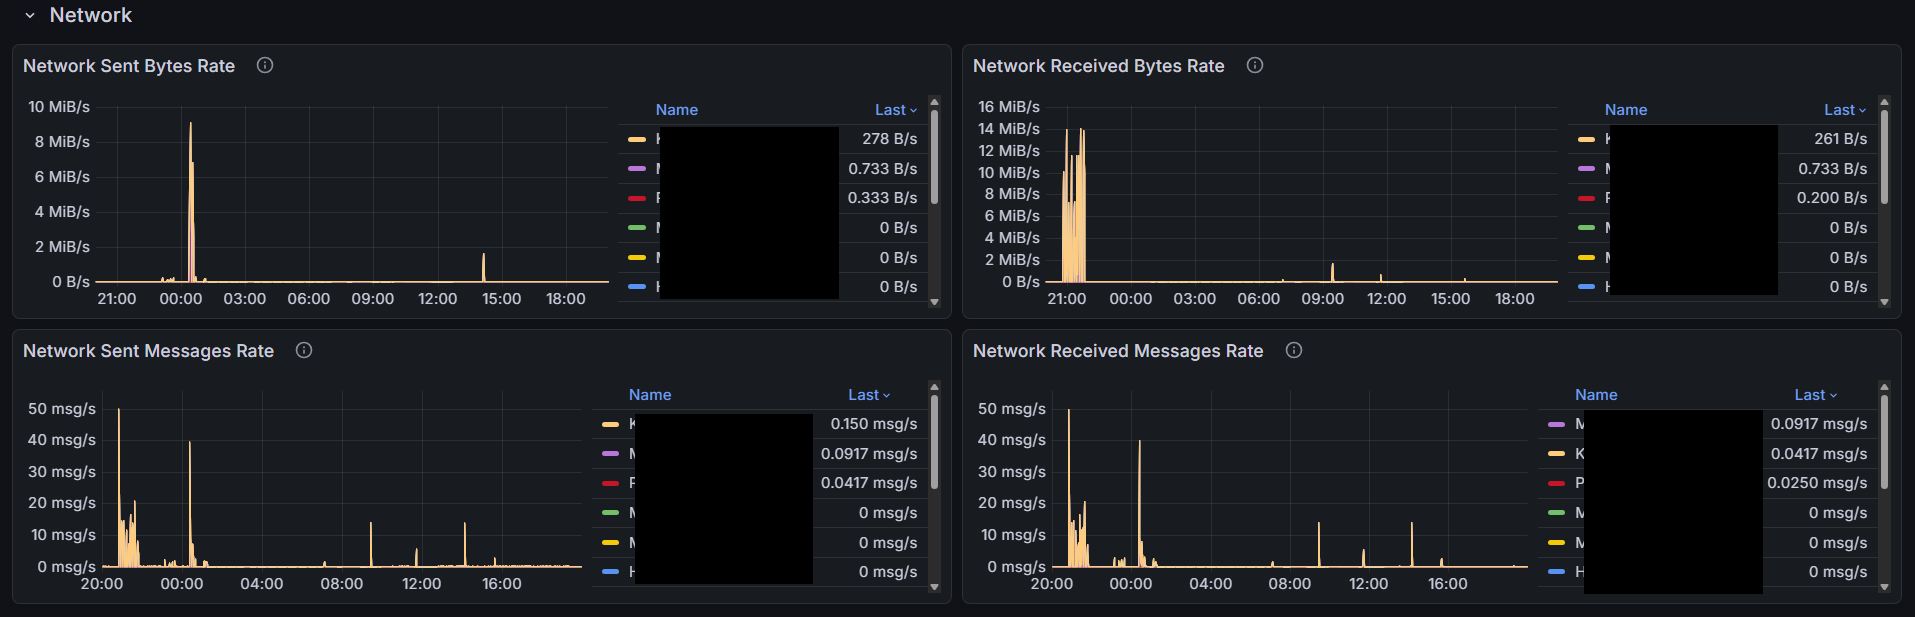
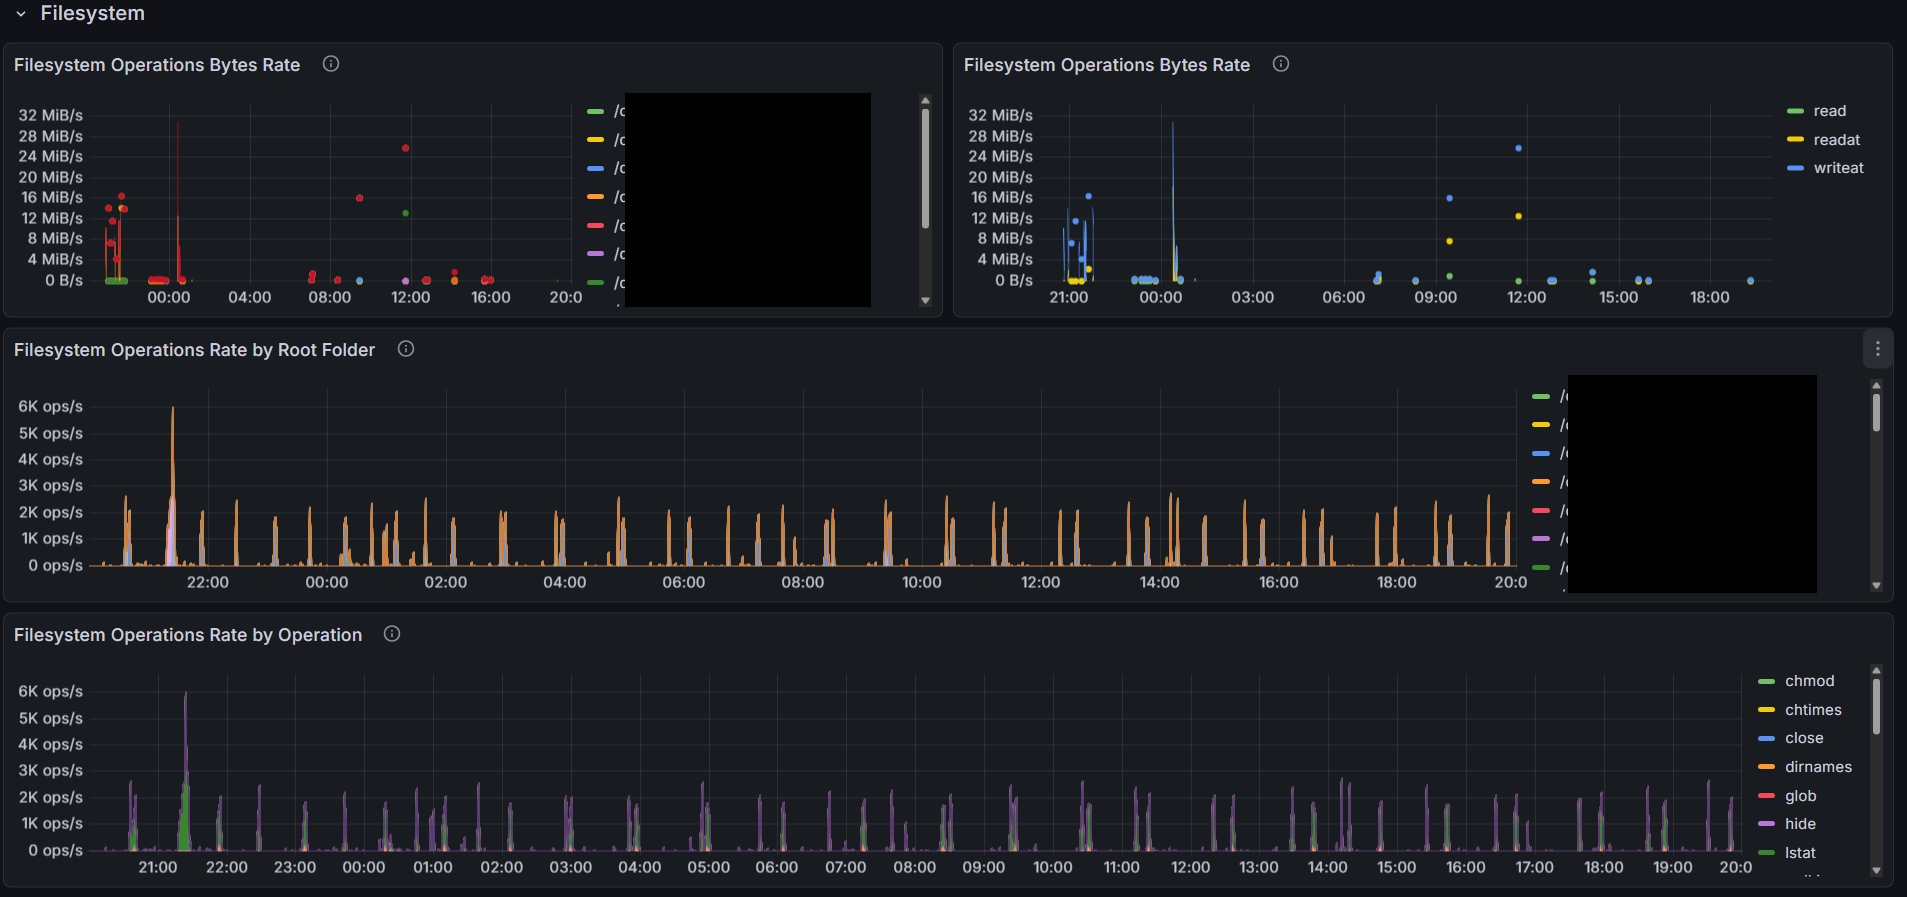
Here’s my first cut at a dashboard for your own syncthing instance based on the metrics published by syncthing itself. This is probably not that interesting for monitoring a very simple setup of 2 machines and 1 folder. But if you have a wider network and or multiple folders, or a lot of activity, you may get some value out of it.
To use it, configure Prometheus to scrape your syncthing server at http://localhost:8384/metrics at an interval of your choosing. I use 15 seconds. Then add the attached dashboard to your grafana instance. If you didn’t understand a word of this paragraph, please do some basic reading on Prometheus and grafana before asking questions that are more quickly answered by Google Gemini or a straight up Google search.
It’s not perfect, but I think it’s a good start. No doubt it can be improved with some additional metrics added. There are perhaps a bug or two in terms of metrics not published after syncthing restarts. And no doubt it can be improved with the current metrics that are published. The intent is to eventually merge this (once there is feedback and general acceptance it’s good) as reference material via a pull request such that it can live with syncthing and be easily found by someone that wants to set it up. Constructive feedback is more than welcome. Also note I tried to optimize the query response payload because I intend to use this to monitor a few systems around the world, and I happen to be 8000 miles away from the Prometheus server at the moment.
I made a number of “improvements”. It’s still a little bit of a work in progress, but I think it’s getting close and should be 100% useable. I’m attaching the latest version below. Has anyone tried the previous one? Any feedback? Please check out the latest one. If there’s interest, I can try to make a pull request to add the dashboard to the repository so it can serve as a starting point to anyone else interested in using it for their instance.
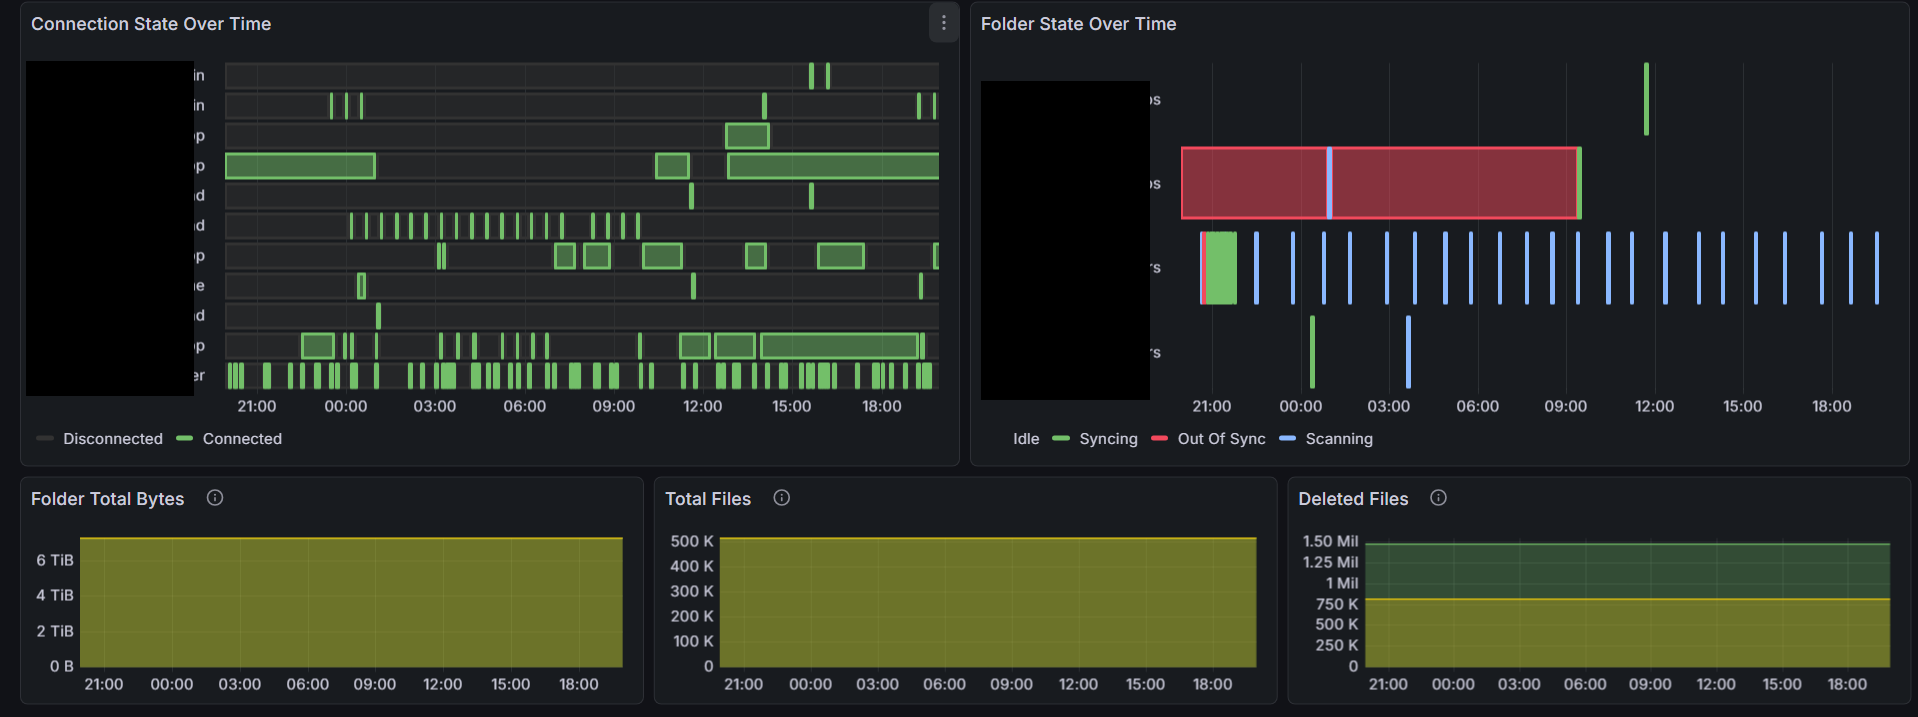
Note many times for small transfers the whole process completes in less than 1 second, or certainly within the scrape interval. In these cases the dashboard will show no activity in the state timelines, but should still show the bytes or files added or removed. Anyway if you don’t see a state change but you see bytes added, this is why. Also there’s a bug in grafana’s state timeline that causes an error in the state timeline panel if all the series are removed by filter which is what happens if there are no folder (or device) state changes registered during the time window.
Here’s the current dashboard. Feel free to check it out and provide feedback. Thanks.
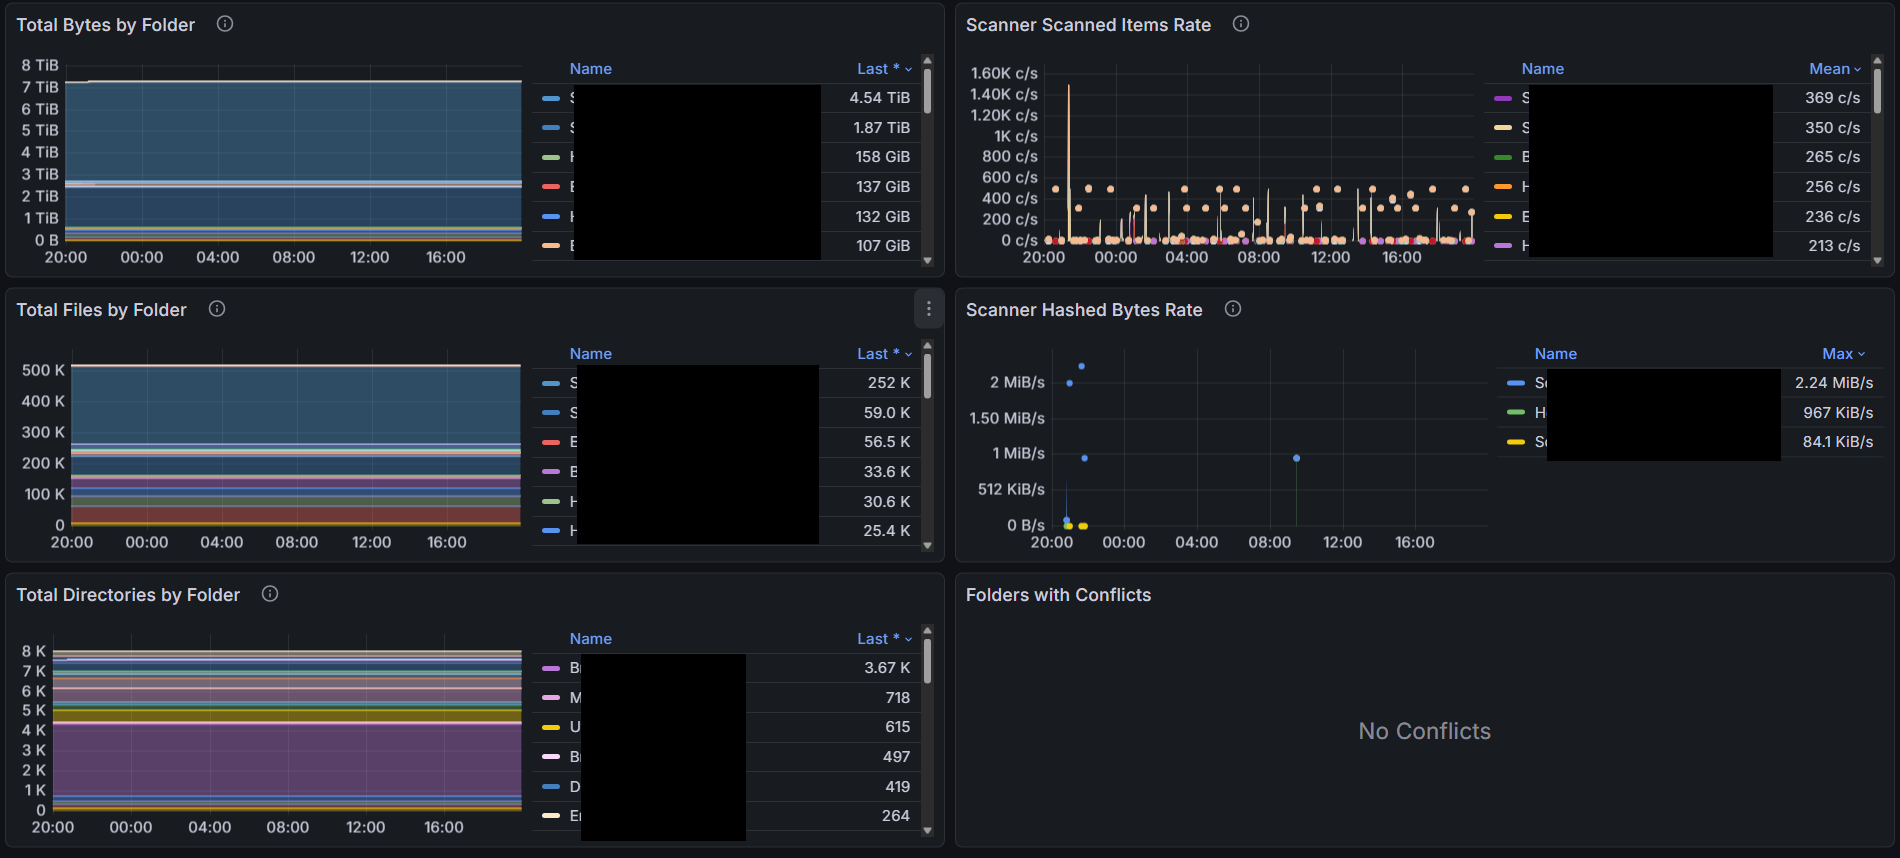
Also note there are possibly a few bugs in the metric reporting in the syncthing code. The two I have observed so far both relate to reporting of syncthing_model_folder_summary.
After a syncthing restart, some folders have no syncthing_model_folder_summary metrics reported. Even after the initial sync, if there are no changes to the folder detected, the folder metrics can be missing. A quick check of the code indicates the metrics are handled by a class that keeps track of the metrics which are updated by calls to the class as activities occur. I suspect it’s a simple fix to add a metrics update whenever a scan completes (whether any changes are detected or not.) or add a metrics update as soon as the startup completes.
Also I have noticed sometimes when a device connects with updates to a folder and then disconnects (or even not?) the folder statistics (total bytes, total files, total directories, global and local) all go to zero. No idea how or why this is happening, but it’s also not correct.