I’m running Syncthing on a small NAS with 2GB of RAM.
The NAS basically has a couple of large send-only folders (about 1TB and 300GB respectively), and a few very small (I mean, megabytes) two-way folders.
With this kind of setup, I know precisely when it’s time for Syncthing to wake up.
Today I heard the drives were spinning for no reason, logged in and found Syncthing was using 2.7 Gib (!) of RAM; the entire machine was close to unresponsive, so I restarted Syncthing from the GUI; immediately after the restart, memory was about 150Mib, and after say, 10 minutes, was 250Mib.
Syncthing didn’t do anything in the meanwhile.
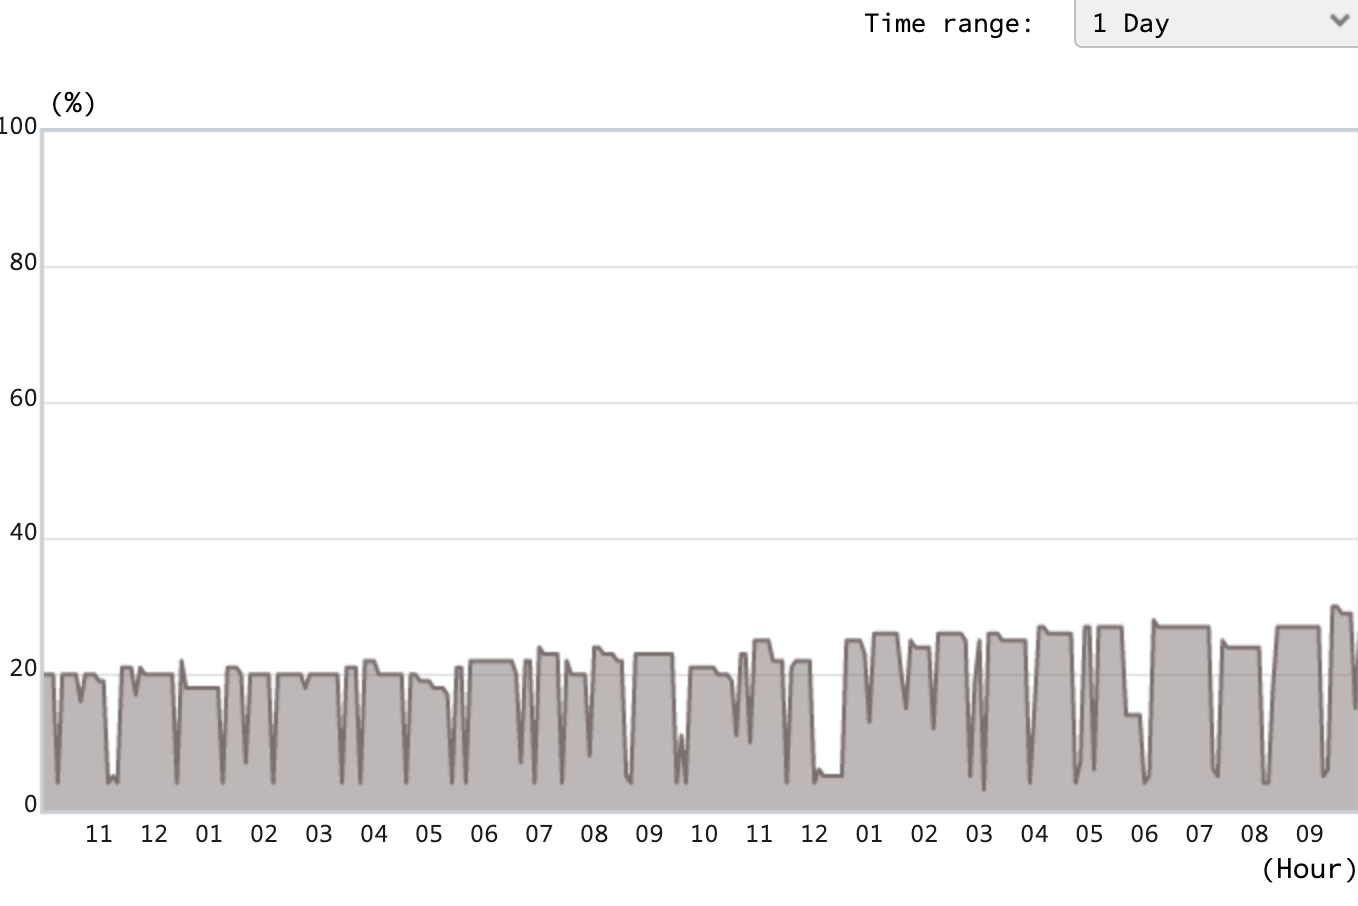
All devices are idle, cpu usage is < 0.1%
The only odd thing I noticed is that there were two syncthing processes running, one using ~ 0 memory, but that may be normal.
I’ll take a heap profile next time.
If you have a clue in the meanwhile, I’d appreciate.
The db does not look huge to me.
Not sure if this is of any help:
[start] 18:22:04 INFO: syncthing v1.4.0 "Fermium Flea" (go1.13.8 linux-arm64) teamcity@build.syncthing.net 2020-03-06 19:52:22 UTC

[start] 18:22:04 INFO: Using large-database tuning


134320728 Mar 22 21:27 076608.ldb
 51699228 Mar 22 21:27 076609.ldb
134369757 Mar 23 10:28 076614.ldb
134332590 Mar 23 10:28 076615.ldb
134343390 Mar 23 10:29 076616.ldb
134322887 Mar 23 10:29 076617.ldb
134355440 Mar 23 10:29 076618.ldb
134300150 Mar 23 10:29 076620.ldb
134242502 Mar 23 10:30 076621.ldb
     8775 Mar 24 18:22 076632.ldb
     4054 Mar 24 18:31 076633.log
134358341 Mar 24 18:22 076635.ldb
       16 Mar 24 18:22 CURRENT
       16 Mar 24 18:22 CURRENT.bak
        0 Aug 26  2019 LOCK
   207825 Mar 24 18:22 LOG
  1048718 Jan 16 19:24 LOG.old
     2463 Mar 24 18:22 MANIFEST-076634
134343390 Mar 23 10:29 ./.config/syncthing/index-v0.14.0.db/076616.ldb
        0 Aug 26  2019 ./.config/syncthing/index-v0.14.0.db/LOCK
 51699228 Mar 22 21:27 ./.config/syncthing/index-v0.14.0.db/076609.ldb
134300150 Mar 23 10:29 ./.config/syncthing/index-v0.14.0.db/076620.ldb
134355440 Mar 23 10:29 ./.config/syncthing/index-v0.14.0.db/076618.ldb
       16 Mar 24 18:22 ./.config/syncthing/index-v0.14.0.db/CURRENT.bak
134369757 Mar 23 10:28 ./.config/syncthing/index-v0.14.0.db/076614.ldb
     4054 Mar 24 18:31 ./.config/syncthing/index-v0.14.0.db/076633.log
134320728 Mar 22 21:27 ./.config/syncthing/index-v0.14.0.db/076608.ldb
       16 Mar 24 18:22 ./.config/syncthing/index-v0.14.0.db/CURRENT
134242502 Mar 23 10:30 ./.config/syncthing/index-v0.14.0.db/076621.ldb
134358341 Mar 24 18:22 ./.config/syncthing/index-v0.14.0.db/076635.ldb
  1048718 Jan 16 19:24 ./.config/syncthing/index-v0.14.0.db/LOG.old
     2463 Mar 24 18:22 ./.config/syncthing/index-v0.14.0.db/MANIFEST-076634
134322887 Mar 23 10:29 ./.config/syncthing/index-v0.14.0.db/076617.ldb
     8775 Mar 24 18:22 ./.config/syncthing/index-v0.14.0.db/076632.ldb
   207825 Mar 24 18:22 ./.config/syncthing/index-v0.14.0.db/LOG
134332590 Mar 23 10:28 ./.config/syncthing/index-v0.14.0.db/076615.ldb
Please get a heap profile to see what is using the memory: https://docs.syncthing.net/users/profiling.html. Alternatively run syncthing with the STHEAPPROFILE environment var set, which will continuously create heap-profiles.
one more question: this instance was installed originally with Syncthing 1.21 and auto-upgraded since then.
Is there any special maintenance to do? e.g. manually clean or compact the db?
or any configuration setting to add?
It depends, this memory allocation does not have to be unusual. Because every file, every directory, i.e. every element must also be managed. But I guess that each element occupies +/- 1kB in RAM. Simon can say more or better about that.
Hence my question, how many peers (folders) have you created and how many files and directories (top right under “This Device”) are managed?
What Andy says, to some extent. There will be some overhead in handling a large setup > 1 TB. Additionally, in detecting this Syncthing makes a trade off for performance over memory usage:
[start] 18:22:04 INFO: Using large-database tuning
You can set the database tuning to small in the advanced config. This will reduce RAM usage somewhat. Your profile is busy scanning and running a database GC. You might want to reduce the GC scanning interval to make that happen less frequently, as you have a large database and slow computer:
Let me point out that the reason I raised the issue is not because the allocation is unusually large, it’s just because memory usage seems to increase over time for no evident reason (for example, now it’s fluctuating between 600 and 800Mib, according to ST web interface, and ST has always been idle - no new file was added/touched anywhere).
peers A and B are always on. that remaining 2 peers are off 99% of the time.
folder A and B are shared send-only with peers A and B respectively.
the other 4 folders are basically empty.
folder A is 115000 files, roughly 1TB.
folder B is 25000, roughly 300GB.
both trees are well balanced (i.e. no single folder in the tree contains, say, more than 100 files).
as I pointed out, I’m not saying that memory usage is large or small, I’m just saying that it seems to grow over time (something that never happened before the upgrade to 1.40).
I’m hearing more “fluctuate” (grows and then decreases) than “grows over time” (continuous increase until, presumable, crash). I suspect this is the (new in 1.4) database GC which traverses the whole database periodically and (in large database tuning, at least) will likely result in fair amount of in-memory caching.
The one thing in your profile that might generate continuous growth is the QUIC usage. We’ve seen some reports of leaks on that previously. You could try and disable QUIC (set listen address to tcp://:22000, dynamic+https://relays.syncthing.net/endpoint instead of default, on both sides) and see what effect that has.
thanks for the hint.
I’ll definitely try it here. As the entire country is in “soft lockdown”, now I cannot physically reach the other two peer machines.
Is this a change in 1.40? I’m asking, because I never had any issue since I started using SyncThing 1.21.
anyway, if I see another unusually high memory usage, I’ll take another dump.
No, only the db GC thing is new in 1.4. But, you might not have noticed the slight upward trend until the larger fluctuations started happening, causing you to investigate?
Additionally, it looks like logging in the web interface does trigger something. After a couple of seconds from login, memory usage spikes up, cpu usage briefly goes up too, but eventually some memory is released (some is leaked, so the final result is higher than the initial).
Did you upgrade regularly or directly from 1.2.1 to 1.4.0? In 1.3.0 and 1.3.1 we updated the quic library versions, and the leak might have been introduced there.