Yes, I updated regularly. Auto-updates are on.
I’m not very familiar with QUIC: can I see if it’s indeed being used? .e.g in the logs, maybe
Yes, I updated regularly. Auto-updates are on.
I’m not very familiar with QUIC: can I see if it’s indeed being used? .e.g in the logs, maybe
It is used, that’s evident from the heap profiles. You can disable it:
I just applied the change here (memory was 1.3GB) and restarted. I’ll see what happens now.
the only thing that changed recently on my side: one of the peers (which is just an offsite backup, actually), auto-upgraded to 1.40 and it’s been sort of “stuck” since then. The web gui says:
“Syncing 95%”, download rate: (a few hundred bytes, changes sometimes), out of sync items: 489 (never changes), 0 BYTES.
the list of items pops up empty.
I cannot go and check the machine physically (because of the covid-19 lockdown), but it’s not the first time it happens. I thought it was due to the folder being send-only. Maybe this “permanent connection” is what is creating the disturbance in the Force…
The situation is a bit better, but still weird…
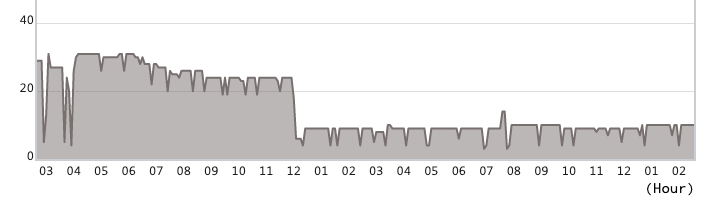
This graph is memory usage in the last 24 hours. The leftmost 03 on X axis means March,27,h15:00. yesterday at 16:00 I disabled QUIC locally and restarted Syncthing (shown as the leftmost 04 in the graph above). Syncthing logs:
[start] 16:00:12 INFO: syncthing v1.4.0 "Fermium Flea" (go1.13.8 linux-arm64) teamcity@build.syncthing.net 2020-03-06 19:52:22 UTC
[start] 16:00:12 INFO: Using large-database tuning
Memory climbed up after a while, then decreased and at about midnight, suddenly dropped.
In the logs, there’s literally nothing. The last line from yesterday is at 16:04, the next line is 10am today.
[B3TV5] 16:04:07 INFO: Device ... client blah blah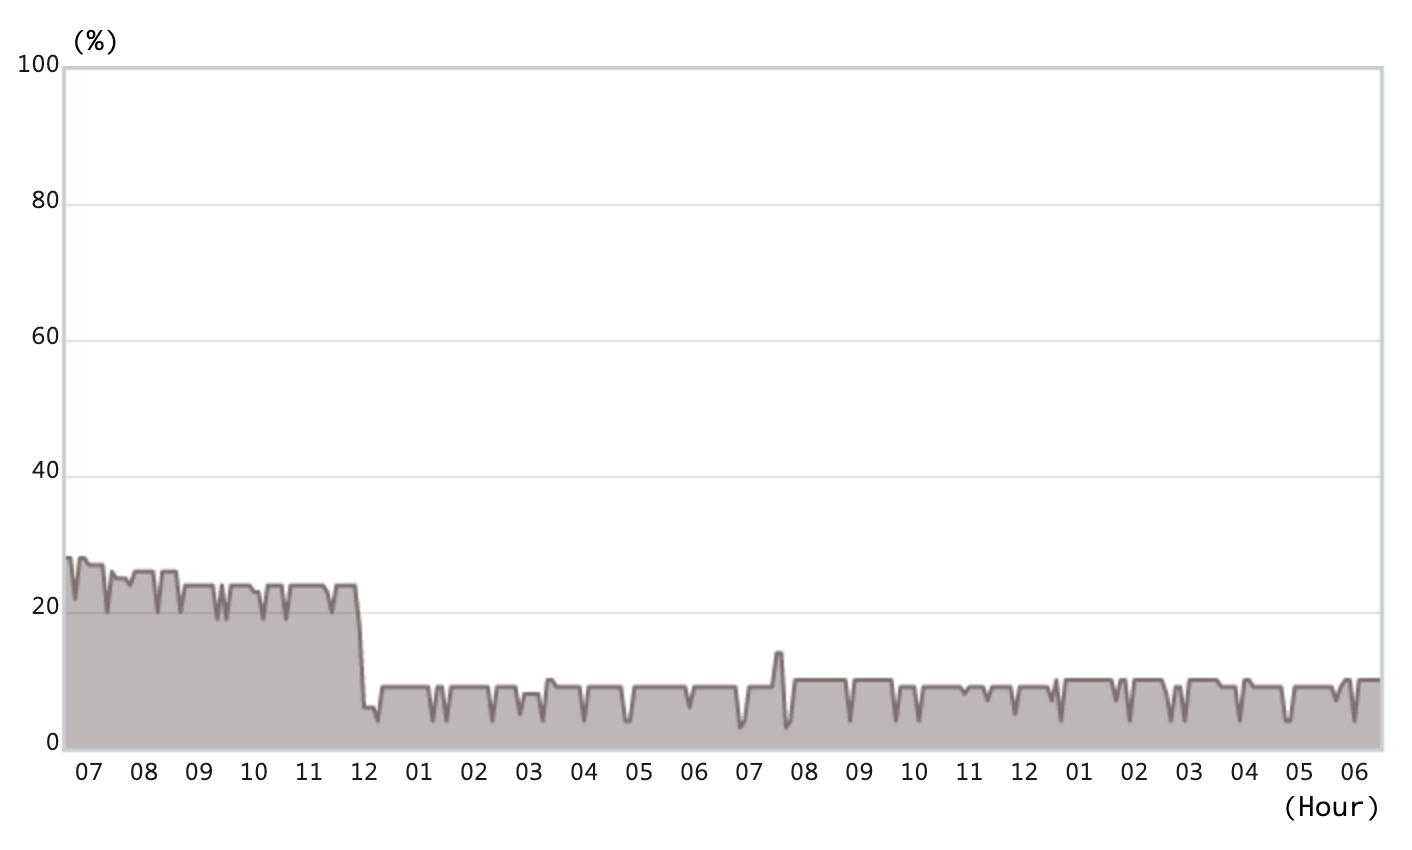
[B3TV5] 10:20:37 INFO: Connection to ... at ... closed: read timeoutWhat’s the y axis unit?
I think it’s memory %. The NAS has 2GB, and currently Syncthing is using more or less 200MB (so 10 on the graph).
My hunch says this is megabytes, I don’t think we start off with 200mb usage straight off the bat?
Allow me to me insist. When you say “I think” in English, it doesn’t necessarily mean you are not sure, you are just being kind. Yes, it’s really memory usage % (see attachment) and yes, Syncthing does take 200MB on startup.
Right, so from 400 to 200 or so MiB. I think this is expected. I can’t explain the difference over time, but a) there’s a lot of things going on internally, b) a lot depends on what other devices are doing or whether the GUI is up, GC is running, etc, c) it’s all garbage collected and managed by the Go runtime which will release memory back the OS when it feels like it, and d) the OS might not reclaim that memory until it feels like it…
So yeah. YMMV. This looks reasonable to me, with large database / folder sizes and all.
Sure, I guess for the folders of that size, with large db settings it might end up that way.
Ok, I officially confirm this fixed the problem.
Today I added a few gigabytes on the NAS and turned on one of the peers (a huge Windows machine, where I didn’t apply any configuration change); this started a sync, so memory usage went up, but I’m wondering: if QUIC is disabled just on one side, what should happen, precisely?
If the other side is announcing a QUIC listen address we will still try to dial it. Whether that results in a mem leak or not I don’t know.
This topic was automatically closed 30 days after the last reply. New replies are no longer allowed.