I’m running Windows 7 SP1 Ultimate and when I start Syncthing v0.14.51,Windows (64 bit) “Dysprosium Dragonfly”, after around 24hours all RAM is used up (8gb RAM).
When not running Syncthing, there are no memory issues (2-3gb used RAM for 5+ days).
Is there an issue with memory management on Windows 7 SP1 or Syncthing just leaking all over?
Running the same on Windows 10 without any issues at all.
First, check task manager if it really is the syncthing process that is eating up memory.
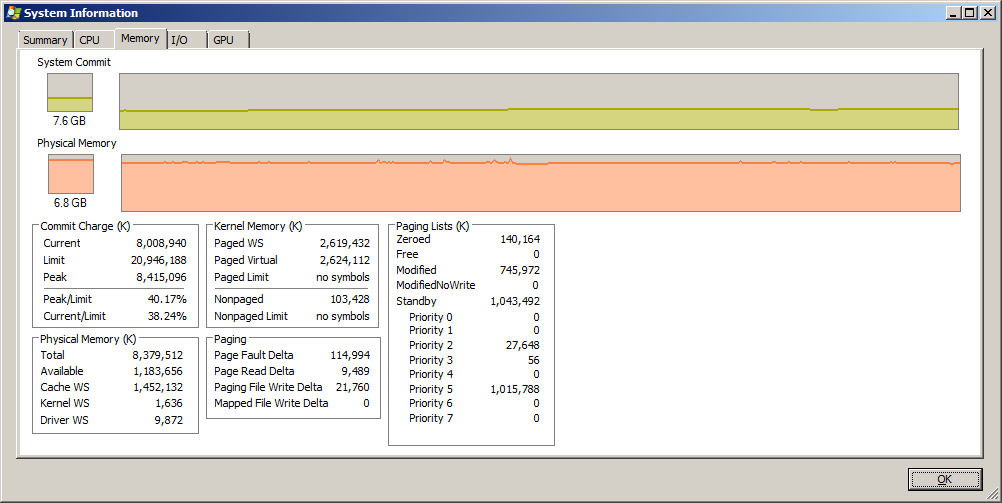
I could guess that it is Win 7, my Win 7 machines also like to fill up over time - even though the memory reserved for processes is NOT increasing. I can higly recommend the tool RAMMap from Microsoft (https://docs.microsoft.com/en-us/sysinternals/downloads/rammap)
The tool can show you how memory is used on your system. It also has a feature to empty cache memory (all data that is not reserved by someone is freed), this usually resets my usage from 90% to < 15% usage on a 16GB system. I repeat this usually every 48h when I have the system running for a long time. Other obvious solution is a reboot.
As I’ve stated, when not running syncthing there are no issues with Windows 7 memory - I’ve had the PC on for 5+ days without syncthing and memory is not an issue.
As soon as I run synthing, memory gradually increases over time until it gets filled and windows reports low memory usage requiring program closures.
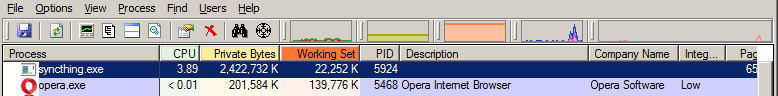
The issue is when syncthing is running, Window 7 memory runs out. If it only ‘uses’? 22mb of working memory (2.4 gig private), then why does Windows 7 run out of physical memory ONLY when syncthing is running?
I’m not a dev, i dont know how syncthing was designed on memory management or usage, but i can tell the difference between when an app is running or when its not, and see its end results. Sure a 22mb .exe may be one thing, but obviously (in your opinion) thats not the ‘issue’?
So however it operates in maintaining its db, file sync, or whatever else it does with ram has nothing to so with its memory usage?
I don’t know, but you should try and understand whats using the memory rather than blindly accusing syncthing, when the questionable utilities you are using clearly show its using 22mb.
Also, perhaps you should use standard tools provided by the OS.
@AudriusButkevicius That’s incorrect. OS tools cannot show the private memory set but Sysinternals ProcExp can (which the OP is obviously using). Sysinternals was bought by MS and thus can be considered a reliable toolkit. For me, this looks like a memory leak too, but I’m not sure if Syncthing is the cause as it can also be a result of DLL injection (e.g. done by AntiVirus, firewall or even malware).
My understanding of windows memory management is non-existant. If I’d see memory usage being high in syncthing in the task manager, then I’d acknowledge an issue, now I just see some different set of numbers with different names that doesn’t mean much to me.
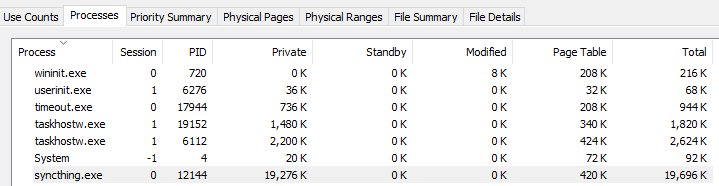
Windows Task Manager only shows the active memory set. Windows knows “real physical” memory (RAM) and “virtual memory” (page). Going back into my c++ times, I recall reserving memory was done by two different “alloc”-function: VirtualAlloc and LocalAlloc . As far as I understood, an app with some MBytes on the task manager may have more standby (cache) memory or page memory allocated for its private use. That’s what the tool shows. It can be better seen from RamMap (also Sysinternals) because RamMap shows of which types the private memory working set of an app consists.
Even stress testing the UI with scan requests, debug ON, hitting buttons frequently, I cannot reproduce the leak reported by the OP. My instance runs fine since hours.