Just putting this out there in case others are having the same issue. So treat this as an observation.
So recently I rejoined two instances of Syncthing, essentially putting it all back to how it was on 1.3.4. Since 1.5.0, im finding that occasionally the computer will be so locked up that I have to pull the plug. I have had to hard restart twice in the past week. The GUI has been unresponsive several times.
I have also noticed my database folder is now hovering between 5 - 10Gb and CPU threads earlier today was 556. Which has been mentioned and the response was due to me using USB drives. Which I still use them, I have also invested in an i9 / 32Gb / 14Tb (large sync) data drive but gut feeling is 1.5.0 may not be able to scale to large volumes of data / lots of folders in a windows environment.
I’ve set concurrency to 10 (was -1) and will see how it goes, but I have the horsepower to keep on top of things, but St is somehow locking things up.
As I said, observation, not a bug or support request.
Could someone with a large deployment of Syncthing on windows please chime in with a counter-example. No need to be specific, just to counter the gut feeling that 1.5.0 doesn’t scale in general on windows.
I am not saying the problems described in OP aren’t real, in fact we have discovered one dead-lock bug recently and there’s an open issue about lots of threads while syncing, but OP specifically mentioned there not interested in support/bug debugging, so that’s off topic here. In general: If you encounter similar (or not) problems, please do provide information and we are happy to help debug and improve the situation!
I don’t mind helping out with bug finding, however I don’t wish to waste any devs time looking for something that I can’t reproduce consistently.
Just to also add, when the PC is hanging, I can still hear the drives grinding away so I know St is syncing.
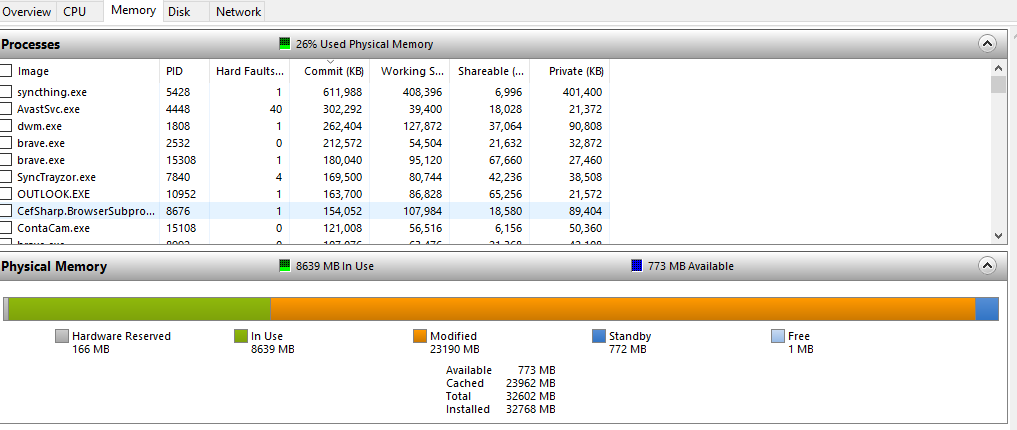
Apparently I did have a panic log generated recently - panic-20200423-154651.reported (I can post here if needed), interestingly it says it ran out of memory, I recall that as the resource monitor was showing 23Gb, infact like it is at the moment…
After posting my last reply, I started googling ‘modified memory’ in order to see what it contained and how I could clear it down. This lead me to a thread which suggested that I disable write caching on all drives as that uses modified memory. So having done that, restarted the PC and St, the mod mem is staying low.
Might be too early to speculate, but just perhaps the nature of St and the way it scans / hashes / works, is creating a larger than normal write cache memory useage and thus, runs out of resources when many folders are being scanned (concurrency -1)
Thanks - that’s very nice and is a much better vibe than I got from your original posting. Maybe that was just me misinterpreting something.
As to wasting dev time on issue you can’t easily reproduce I very much feel you, I hate it when I have an unreproducible problem with a software I don’t know well, because both just ignoring and filing a not actionable issue aren’t what I want to do
However what you can always do here is start with a “disclaimer”, that you didn’t nail this down and thus recommend not spending much time on this. Then still provide the info you have. There’s always a chance there’s something related going on someone knows about or someone asks the right question that points you at the underlying problem.
The OOM panic shows what goroutines were running, which might indeed be insightful. It doesn’t show what was using the memory, for that run Syncthing with STHEAPPROFILE environment variable set: This will automatically create heap profiles showing how much mem is used for what.
I don’t know windows memory management, but if it works anything like linux this wont help at all and probably slow your system down. Memory cache means that often accessed files are kept in memory, unless memory is explicitly required by a running program. Meaning it only uses otherwise free memory.
Just an update after Synthing has been running for almost 3 hours.
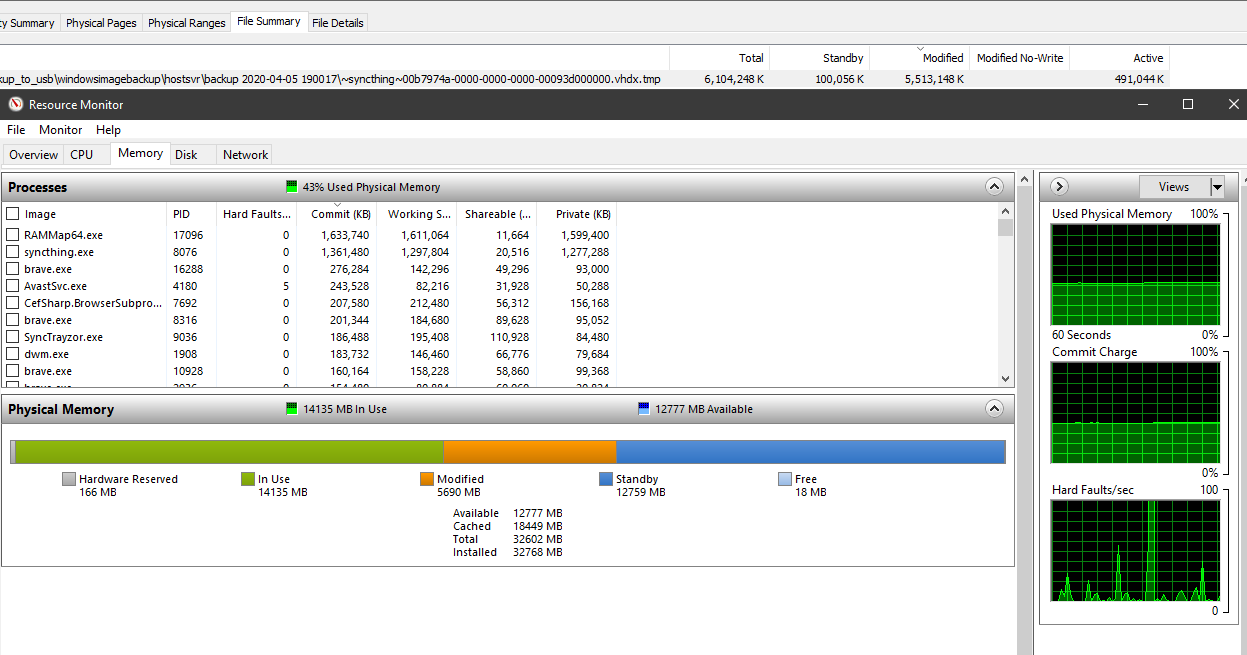
Initially the disabling of the write cache appeared to help, the modified memory was very small, but once St started resyncing a very large file (900Gb ish), then the modified memory useage has started to creep up. Seems that whilst St it self is only using a small amount of ram, the sync job itself is much larger, with 5Gb of ram allocated to it…
So in the screen shot I have the resource monitor sitting on top of rammap. This shows what the modified memory allocation is, and presently it’s showing the large tmp sync file is using 5,513,148K of the 5690MB modified (in orange)
I appreciate that St needs memory to run, but could explain why myself and others keep running out of memory, or having lockups.
The amount the tmp files ram usage is increasing is consistent with how much it’s downloading. Therefore I wonder if the file is actually being saved to the disk. Disk activity suggests it is being written occasionally.
Could it be a GO issue? It only is affecting one file, all the other sync folders are not affected by the caching.
Only other thought is maybe there’s massive block fragmentation and St / windows has to allocate chunks of ram in order to fill in the gaps before it can be saved back to disk? I’m assuming here that St doesn’t download at block 0 and keep adding until it’s a complete file. Is there any means of looking at what blocks have been downloaded or see the level of fragmentation?
Syncthing downloads blocks in random order, but I think it truncates the file to it’s final size before starting, so your filesystem should know ahead of time how much space is needed. We only fsync the file after it’s finished downloading, so perhaps some weird filesystem that you are using buffers it into memory?
I know on Linux there is O_DIRECT flag, perhaps there is something equivalent in Windows.
I don’t think Go or syncthing is at fault here to be honest. I’d try to reproduce with a small python script that writes a file in random order.
Also, none of this has changed recently, random download order has been a thing for ages.
Searching for “modified memory” this is indeed outstanding disk writes. So this points at your disks as the bottleneck. Did you do health and performance checks on your disks? Given you invested quite a bit into hardware on your system, this would definitely be worth testing. It might be annoying to hear over and over, but investigating disk/disk controller to me is the logical next step - at minimum check SMART values, probably also run some disk benchmarking/testing tool.
Nevertheless it’s surprising to me that Windows, respectively whatever filesystem implementation is in use, lets programs do more disk writes instead of blocking to the point where it needs to OOM kill the same program.
Is this maybe the same “fast network, slow disk” problem we troubleshot in the “load average over 9000” issue? We don’t see the number of threads in Syncthing, but it could be lots of them and maybe the buffer for an outstanding blocked write gets accounted like this in Windows?
I had to pull the plug on the PC as I was experiencing a very unusable PC. But the file that was consuming the ram was on a SATA drive, brand new from end of March. It’s reporting 250Mbs/s
I’m going to start St with just the one folder that’s on the sata drive and no other folders. It’s going to clear the index, but I can live with that and see how it is in the morning.
I’ve been running for three hours on a internal SATA drive with a single folder and it’s already creeping up on memory usage.
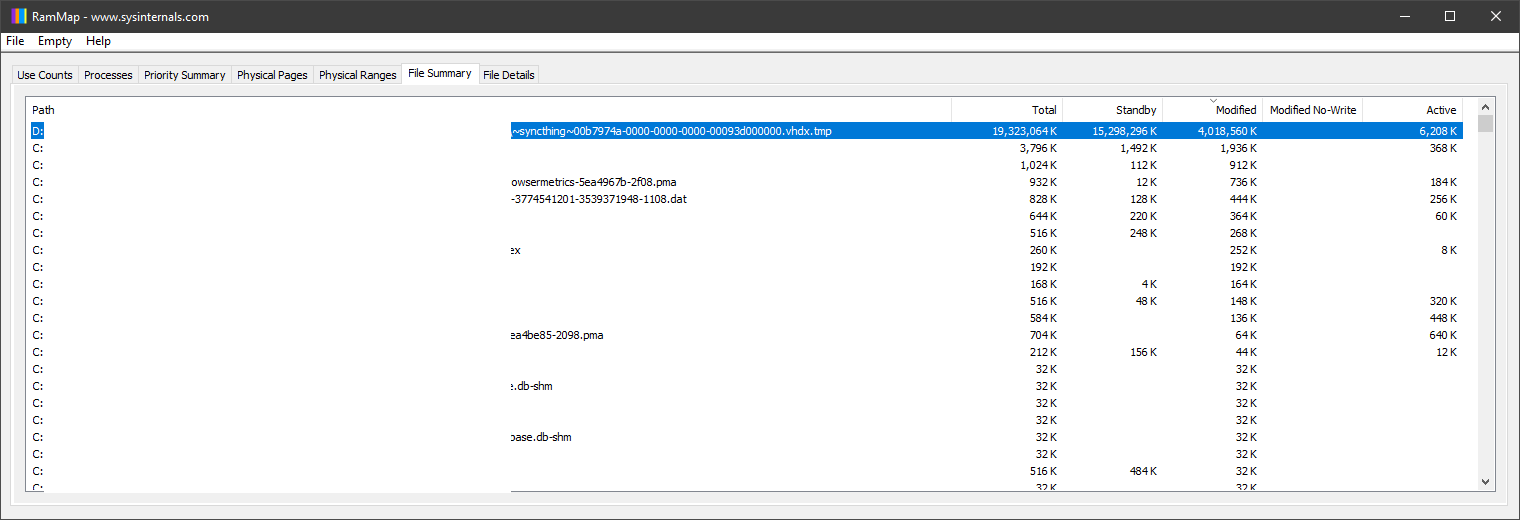
I’ve attached a screenshot where Rammap shows a 21GB memory mapped file where the modified page size slowly grows. As it grows it causes other programs to page out memory instead of writing to disk. The disk usage is <50% too so it’s not IO bound. Pausing the sync stops the number of modified pages from growing, but the existing modified pages are not written either.
Copying a file from one drive to another using explorer then using Rammap to empty the modified page list works correctly. The copy speed drops to zero as the modified pages are written and the usage drops back to zero.
Attempting to flush the pages using Empty->Modified Page List does not shrink the modified amount for Syncthing though. So they might be still locked in some way, is there some additional tracing or diagnostics I could do to help determine which pages are locked by Syncthing?
I think you might be talking to the wrong people. We use simple file api’s in go, no file or page locking, we literally do fopen(), fwrite(), fclose(), fsync().
I guess you can try the golang-nuts mailing list to see if people have any idea.
In the end I deleted the large tmp file and watched the ‘modified memory’ shrink then the file deleted. Therefore I suspect that is just the way windows works.
It’s redownloading so in theory as long as St can maintain a connection and continue to download I should be ok as this only happens when St is restarted.
So perhaps if people are getting OOM or lockups under windows and there’s large files involved, the simple answer is to delete the tmp file and redownload, or spin up a Linux VM and run St from there.