While transferring large files (5GB+)to different geographical locations via internet we’ve noticed that transfers almost always start fast, and then begin to “settle” into a slow transfer rate of 1-4MB/s. If we restart syncthing on one side of the connection, it’ll reconnect and we’ll start seeing speeds hit near max (~70MB/s) for awhile, then it will slowly setting down back to the 1-4MB/s over the course of the next hour or so. This is consistent with several different sites and network providers, so while I’d chalked it up to some kind of network management on the part of our ISPs, I’m becoming less convinced of that, especially because I can now get a boost in speed on demand simply by restarting one instance. Some additional info:
1.) The sync devices are dedicated hardware, with the database on an m.2 drive and the data moving to a single SSD. Drive, RAM, and CPU utilization don’t appear to be the problem from what we can see. These are Windows based server devices.
2.) Network connections are typically 500Mbit up/down on both sides, with several being 1Gbit.
3.) The timeframe of how this problem presents is a challenge to troubleshooting. We can start a 500GB folder overnight, restart syncthing, and see it moving at 40-70MB/s. When check back in the morning 10-12 hours later, we’ll find it running at 1.8MB/s-4.7MB/s with 350GB left to transfer. If we restart, we can burn through another 50GB relatively quickly (inside of an hour) before it seems to fall back into the slower pattern.
As I’m recording the resource usage and testing this, we’ve moved about 10 files over the last 24 hours, for a total of 270GB, which is an average rate of 3.125MB/s across two 1GBit connections. We see bursts up to 70MB/s after restarts, but the average speeds settles much lower over time.
Is there an agreed upon iperf config for testing bandwidth in a meaningful way in the context of syncthing? It’s not using multiple connections, just a single one correct?
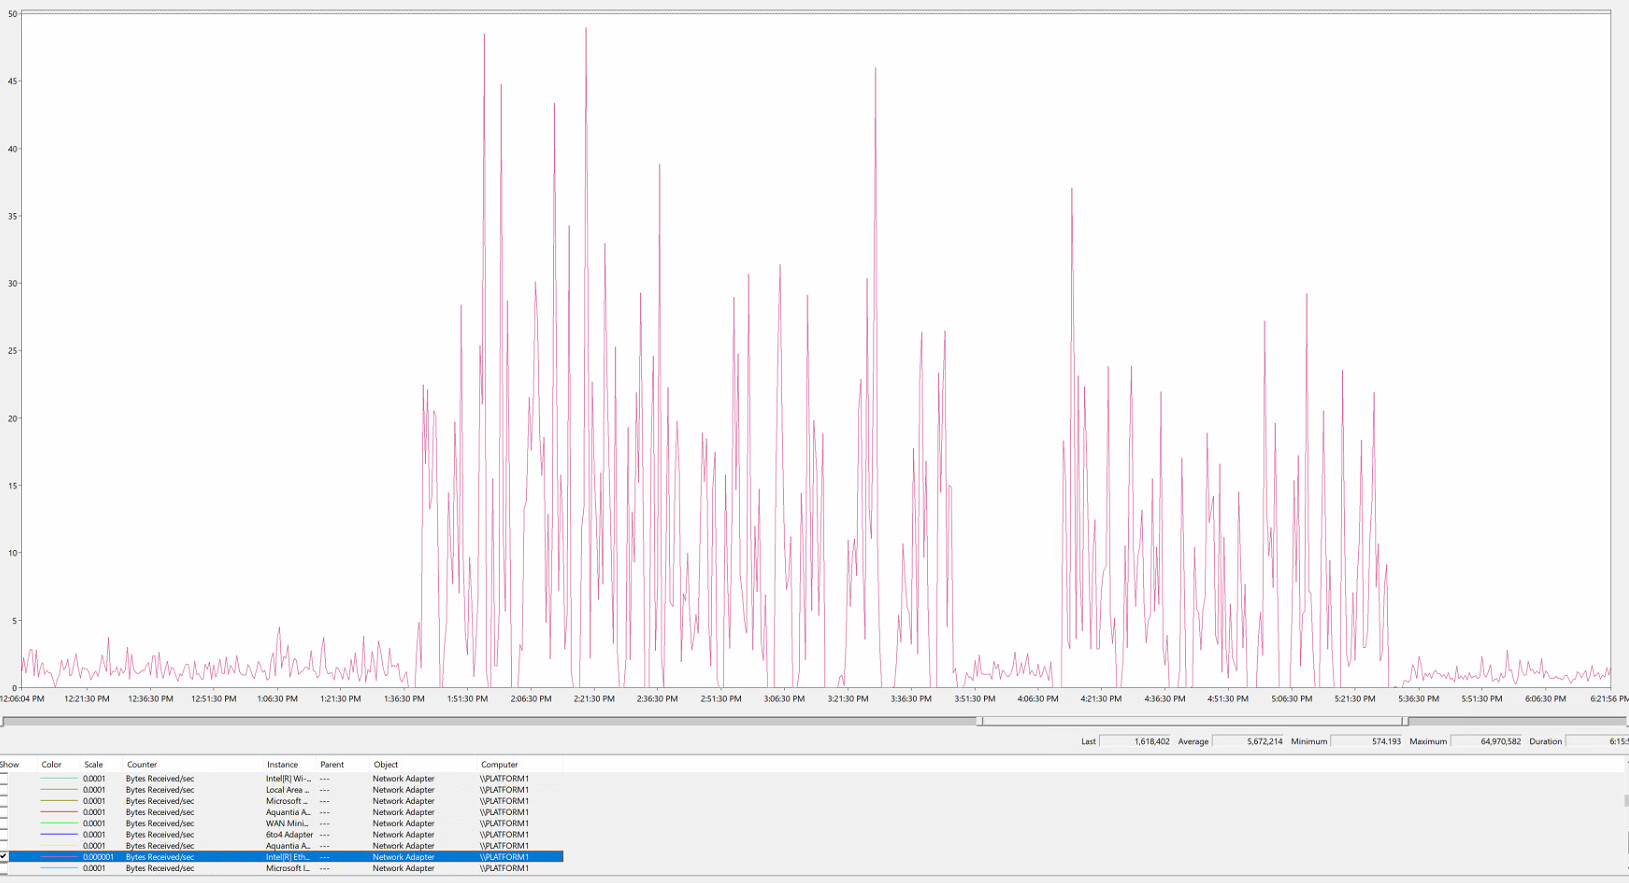
So this is a good example of what we see. This is graph limited to bytes received per second on the network adapter of the receiving unit, taken at 5 second intervals.
Things setting into a 1-4MB/s range for some time, then we force a reset and suddenly see 15-40MB/s as the norm for awhile, then we sink back into 1-4MB/s. This graph likely represents only 1 or 2 files as this set included several 40GB individual files.
Depending on your data this might be somewhat expected; if there are identical blocks in the file, those will be reused from disk when present. So more data => more possible matches => less data transferred over network.
Here’s the same graph with disk idle time in green (at .01 scale) and disk read bytes/second in blue.
These are unique video files, so I’d assume there’s not a lot being reused (I suppose I could be wrong there, data is weird sometimes). It also doesn’t account for the slow average transfer speed (more matches = less data transferred = more complete files moved faster correct?), nor the weird temporary effect that a restart has on that transfer speed.
We don’t use them, no, so they’re set at the default 0 setting. Compiling isn’t something I’m set up to do quickly unfortunately, so I’ll need some time on that. First though I can try setting them temporarily and seeing if it honors them properly over time as well. I’ll do that now and set them for 25MB/s and fire up a few more big files.
I’m early in my test, but rate limiters might be a good place to start looking into.
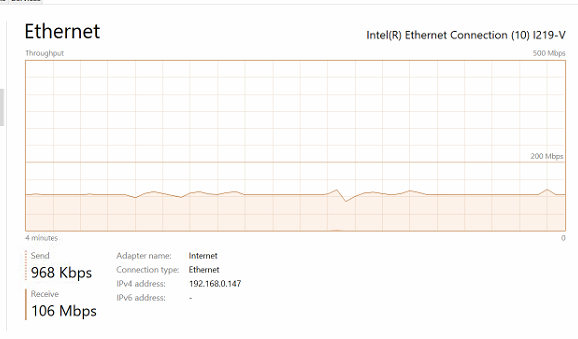
I’m recording another long test now and the initial behavior on the network is entirely different with a rate limit in place. I’ve got things locked down to 12500KiB/s on the receiving limit and the network activity has been rock solid at that line for nearly 40 minutes. Frankly I’ve never seen a cleaner, more steady connection from syncthing in almost 2 years of using it extensively. I’ll have more data to share on this after this data collector is done in the morning, and I plan on increasing the limit a few times during the test to see if this can maintain its consistency as the cap increases.
Here’s a quick look at how clean this thing is right now:
The bug which sparked the ticket is fixed but quic is still a lot slower than tcp. The protocol itself should be able to saturate a gigabit link. On my local wifi the difference is 600 vs 250Mbit/s.
Edit: quic-go uses a quite simple congestion control algorithm which might explain the difference. My point is that OP might be on to something and the quic performance could also be a symptom of that.