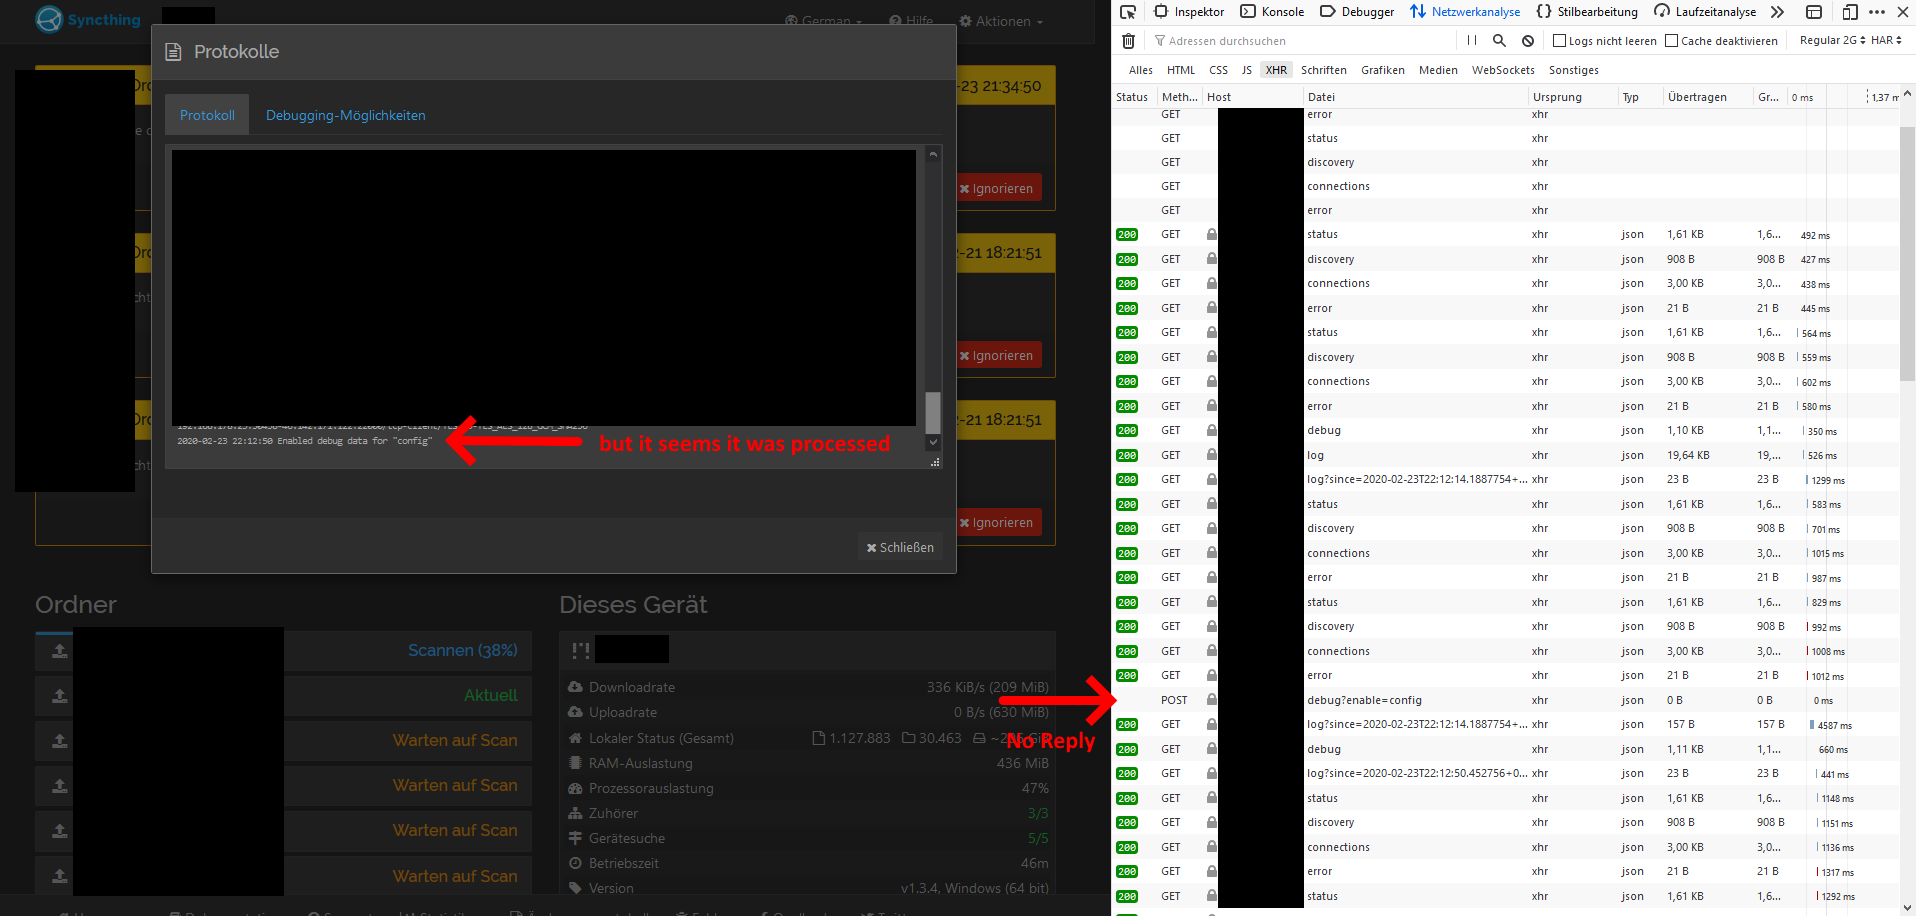
How can i activate config logging, when no config-post is processed by the server?
My guess is that the large number of requests creates I/O activity, which is the bottleneck on a slow computer like this one. Thus the requests don’t get processed as they should. Maybe some mechanism schedules (usually short) read actions higher than write actions like the “config” post. But since there are so many gets constantly fired at the server it won’t ever process the other requests.
A solution could be to throttle the requests fired at the server, if the client detects, that the server is answering slowly. One idea could be to not requests new events or status updates if another request is still pending and only retry after 1 or 2 minutes or so or if the request officially failed.
A fix for this would really be appreciated, as i can not manage my systems with this problem. It’s config hell right now…
First off i have set maxConcurrentScans to one, since my HDD and PC is not very strong, to reduce paralell HDD access.
The problem seems to be there mainly when (several?) folders are scanning and i then try to change any setting in the UI. The config posts are then not replied to. Normal status gets are replied to as you can see in the screenshots.
Here is an excerpt from the log with config-debug enabled:
The error in the screenshot is “400 Bad Request”, which we only return on invalid config (and that would be logged by Syncthing too at warning level). For a timeout I’d expect a 408.
I have the problem again on my local computer (the other one was remote).
I found this in the logs:
[WBZZM] 2020/02/25 21:39:02.175232 folder.go:565: INFO: Completed initial scan of sendreceive folder "Shared" (shared)
[WBZZM] 2020/02/25 21:39:02.176232 api.go:479: DEBUG: http: GET "/rest/events?since=123": status 200, 507 bytes in 1047.29 ms
[WBZZM] 2020/02/25 21:39:02.179226 folder.go:565: INFO: Failed initial scan of sendreceive folder "#Folder1" (Folder1)
[WBZZM] 2020/02/25 21:39:02.186214 model.go:360: INFO: Ready to synchronize "#Folder1" (Folder1) (sendreceive)
[WBZZM] 2020/02/25 21:39:02.186214 model.go:527: INFO: Restarted folder "#Folder1" (Folder1) (sendreceive)
[WBZZM] 2020/02/25 21:39:02.191208 api.go:479: DEBUG: http: GET "/rest/events?since=125": status 200, 506 bytes in 1.00 ms
[WBZZM] 2020/02/25 21:39:02.196201 api.go:479: DEBUG: http: GET "/rest/stats/folder": status 200, 10965 bytes in 9.99 ms
[WBZZM] 2020/02/25 21:39:02.214171 api.go:479: DEBUG: http: POST "/rest/system/config": status 0, 0 bytes in 212666.84 ms
[WBZZM] 2020/02/25 21:39:02.214171 api.go:827: WARNING: Decoding posted config: read tcp 127.0.0.1:8384->127.0.0.1:49393: i/o timeout
[WBZZM] 2020/02/25 21:39:02.215169 api.go:479: DEBUG: http: POST "/rest/system/config": status 400, 54 bytes in 212365.81 ms
[WBZZM] 2020/02/25 21:39:02.216169 api.go:827: WARNING: Decoding posted config: read tcp 127.0.0.1:8384->127.0.0.1:49394: i/o timeout
[WBZZM] 2020/02/25 21:39:02.216169 api.go:479: DEBUG: http: POST "/rest/system/config": status 400, 54 bytes in 212329.79 ms
[WBZZM] 2020/02/25 21:39:02.217166 api.go:827: WARNING: Decoding posted config: read tcp 127.0.0.1:8384->127.0.0.1:49372: i/o timeout
[WBZZM] 2020/02/25 21:39:02.217166 api.go:479: DEBUG: http: POST "/rest/system/config": status 400, 54 bytes in 206834.63 ms
[WBZZM] 2020/02/25 21:39:02.217166 api.go:827: WARNING: Decoding posted config: read tcp 127.0.0.1:8384->127.0.0.1:49417: i/o timeout
[WBZZM] 2020/02/25 21:39:02.218166 api.go:479: DEBUG: http: POST "/rest/system/config": status 400, 54 bytes in 116287.19 ms
[WBZZM] 2020/02/25 21:39:02.543652 api.go:479: DEBUG: http: GET "/rest/system/config/insync": status 200, 27 bytes in 1.00 ms
[WBZZM] 2020/02/25 21:39:02.553645 api.go:479: DEBUG: http: GET "/rest/events?since=127": status 200, 97492 bytes in 13.98 ms
[WBZZM] 2020/02/25 21:39:02.564621 api.go:479: DEBUG: http: GET "/rest/system/config": status 200, 84954 bytes in 22.96 ms
[WBZZM] 2020/02/25 21:39:03.038876 api.go:479: DEBUG: http: GET "/rest/system/discovery": status 200, 599 bytes in 0.99 ms
[WBZZM] 2020/02/25 21:39:03.045869 api.go:479: DEBUG: http: GET "/rest/system/status": status 200, 1056 bytes in 2.99 ms
[WBZZM] 2020/02/25 21:39:03.073820 api.go:479: DEBUG: http: GET "/rest/system/connections": status 200, 2978 bytes in 2.98 ms
[WBZZM] 2020/02/25 21:39:03.077814 api.go:479: DEBUG: http: GET "/rest/system/config/insync": status 200, 27 bytes in 0.00 ms
[WBZZM] 2020/02/25 21:39:03.079808 api.go:479: DEBUG: http: GET "/rest/system/config": status 200, 84954 bytes in 26.96 ms
There you can see the extremely long running config post requests and the 400 response plus some “i/o timeout” errors. Maybe you can find out why this happens?
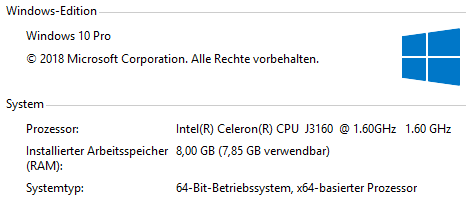
I want to point out: It’s a pretty slow computer with an external USB HDD (not SSD) and it is currently scanning several folders but with maxConcurrentScans set to 1.