I am attempting to Sync a large number of files locally over Ethernet between two Raspberry Pi-like devices (ARMv7 with ~500MB of RAM).
Device (1): 75,000 files @ 600MB total
Device (2): 50,000 files @ 4.2GB total
Scanning completes in a timely manner (10 - 15 mins), but every time, part way through Syncing (usually after ~400-500MB have been synced), Syncthing suddenly eats all of the RAM on one of the devices.
This results in the device completely locking up, and I am only able to recover the system through power cycling. The system does not respond via SSH or a serial interface.
My question is, whether this is considered a bug, or expected behaviour on a low powered system such as a Raspberry Pi?
I have attached a heap profile from when this occurs.
There’s a ton of incoming request, which should be limited. How many folders do you have and what are the config values of maxRequestKiB for devices and pullerMaxPendingKiB for folders?
If everything is at defaults and unless you have a massive amounts of folders, you shouldn’t get that many requests. However there’s also a global request limit in case you indeed have that many folders: maxConcurrentIncomingRequestKiB. That defaults to 256 MiB, so lowering that could help (but shouldn’t be necessary depending on the answers to the questions above).
The files on each device are unique (no common files between the devices)
Folder 2:
Device 1: 300 files @ 70MB total
Device 2: 300 files @ 70MB total
The files on each device are the same (no actual data transfer required)
The crash happens during the syncing of Folder 1
What are the config values of maxRequestKiB for devices and pullerMaxPendingKiB for folders?
<maxRequestKiB>0</maxRequestKiB> for both devices in both configs
<pullerMaxPendingKiB>0</pullerMaxPendingKiB> for both folders in both configs
There’s also a global request limit in case you indeed have that many folders: maxConcurrentIncomingRequestKiB
<maxConcurrentIncomingRequestKiB>0</maxConcurrentIncomingRequestKiB> in both configs
Overall, I believe I have virtually a default configuration file apart from <caseSensitiveFS>true</caseSensitiveFS>, which drastically improves syncing performance for me.
I have attached a sanitised config file (which is the same on both devices apart from GUI IP address) in case you need to take a look.
Thanks for the comprehensive info. Having two folders means max 128MB requests should be outstanding. That doesn’t mean only 128MB memory is used, overhead is to be expected. Though the nearly 500MB in the profile seem too much for that. Regardless of if there’s a bug or not, with only 500MB memory available I’d definitely set maxConcurrentIncomingRequestKiB to something smaller than it’s default (e.g. 64 MB), and maxRequestKiB per device to maybe 32MB.
Unfortunately, the “crash” still occurs, and the Device 1 system still completely locks up part way through syncing.
Is it possible that the memory / heap is a red herring?
Is there any more information I can provide, or anything else I can try? I can’t think of any other ways to troubleshoot this.
EDIT:
It is virtually impossible to get a CPU profile around the time that the crash is occurring, due to the unpredictability of exactly when it will occur, and the system locking up.
Here are two CPU profiles during normal syncing (a long time before the crash occurs):
I notice that the runtime: findfunc function is taking a lot of CPU time. I haven’t been able to find any further information on this, is this what you would expect to see, or an anomaly caused by the profiling?
Looks like an inner part of the GC mechanism so I don’t think that’s an anomaly, it just shows that there’s a fair amount of GC going on.
Assuming you’re still running out of memory I’d suggest adding some swap to get it over the peak, and if possible to grab a memory profile when it’s using a lot of RAM and perhaps we can narrow down why and reduce it.
That said it’s not certain that it’s possible to reduce it enough for your systems and use case. If there are large files we will use large blocks (16 MiB). A block “in flight” is copied in memory several times by necessity. The GC allocator adds overhead. Even our lowest configurable limits allow for some concurrency. Etc, so this all adds up to potentially more RAM required in some situations than you might physically have.
Might setting GOGC=25 environment variable help to trigger GC more often? At least for my raspberry pi (512MB RAM) this prevented huge RAM usage and lockups at the cost of higher CPU usage. However my usage might be different with only rare changes and mostly on one side but more total data on more folders (659 GiB, ~288000 files)).
Assuming you’re still running out of memory I’d suggest adding some swap to get it over the peak, and if possible to grab a memory profile when it’s using a lot of RAM and perhaps we can narrow down why and reduce it.
I would prefer to exhaust all other avenues before adding swap, as I will eventually be running this device with the root partition mounted with a read only overlayfs. But I do understand the requirement for swap if there is nothing else we can do.
In the opening post to this topic I had uploaded a heap profile.
That said it’s not certain that it’s possible to reduce it enough for your systems and use case. If there are large files we will use large blocks (16 MiB). A block “in flight” is copied in memory several times by necessity. The GC allocator adds overhead. Even our lowest configurable limits allow for some concurrency. Etc, so this all adds up to potentially more RAM required in some situations than you might physically have.
Thank you very much for the information regarding the overhead.
In this case, the files are all either 8KB or 84KB, so I am guessing the large blocks will not be an issue?
I’d also lower the maxConcurrentIncomingRequestKiB to the lowest possible (32MiB), in case both folders are hitting the device with requests that should have some impact.
The memory profile showed all memory being used by the buffer-pool in protocol. In the worst case that means GC can’t help, because the sync.Pool hasn’t freed the buffers yet. Still worth a try adjusting GOGC.
I still experience the “crash”, and the system completely locks up.
It would appear that there is no solution to this.
I still find this situation strange, as every time I test this, syncing works for a random amount of time between 20 mins and 90 mins, then the available memory drops from ~300-400MB to just ~13MB in a matter of a few seconds.
As usual, I am unable to get a proper heap profile as Syncthing does not respond, however these are the outputs of the free command only seconds apart:
$ free
>               total        used        free      shared  buff/cache   available
> Mem:         495936      212040        4500        2128      279396      357260
> Swap:             0           0           0

$ free
>               total        used        free      shared  buff/cache   available
> Mem:         495936      468924        4268        2128       22744       13792
> Swap:             0           0           0
I still don’t really understand what triggers this sharp increase in memory usage, as Syncthing works until this randomly occurs.
You can enable model debug logging to see what it is doing when the increase happens (e.g. a sudden burst of incoming requests, or something entirely different if I am completely wrong with suspecting requests ).
Sorry for the delay, not a lot of free time to work on this lately.
I’ve enabled STTRACE=model and run my test again twice.
Interestingly, both times Syncthing still crashed, however it did not completely lock up the system this time with the debug logging enabled. Syncthing restarted more or less straight away both times.
I have attached the Syncthing logs for the second crash, in case it sheds any light:
It’s handling a few thousand small files that almost exclusively need copying (reusing local data), but I don’t see anything strange. Nor a crash, so I presume it’s the oom killer. I’ll repeat myself from before;
Set STHEAPPROFILE and you’ll get profiles automatically when usage increases, just grab the largest one after the fact.
 ) that’s not the culprit:
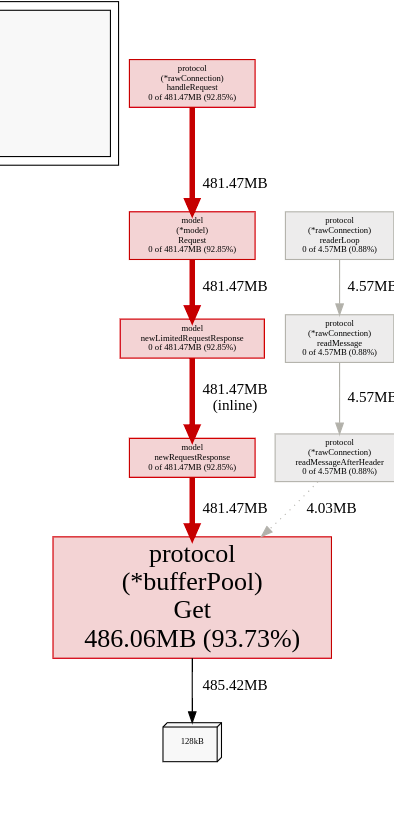
 ).
).