This has happened after a system hibernation in Windows. Basically, Syncthing had been working fine until the OS was hibernated, but then refused to “become alive” again once the OS was resumed from it later.
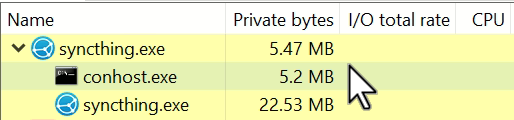
This is the current state. As you can see, the process is still “running”, but there’s no CPU or I/O activity, and the RAM usage is lower than normal. The device itself appears “disconnected”, and the Web GUI isn’t loading either.
Is there anything I can do to debug the problem in this state? I believe I’ve experienced a similar issue before a few times, but I had no idea what was going on then. This time, I’m sure this is connected with hibernation (based on the “last seen” time and the event timing recorded in Windows logs).
Syncthing is v1.18.6 (custom built) and the OS is Windows 10 x86.
What does the logfile have to say? Can you reproduce the problem? What changes have you made in your custom build? If you have made changes, can you reproduce with an unmodified instance of the latest release?
This can’t be reproduced on demand. I could try to keep hibernating and resuming the system until the problem recurs though. The logfile, at least the standard non-debug one, doesn’t help here, as it just stops recording events when the OS enters hibernation and never comes back to life after that.
I doubt this has got anything to do with the custom build though, as a) my changes are mostly cosmetic, and b) I experienced similar problems way in the past when I was still using the official builds (only then I didn’t connect the dots that it could be related to hibernation).
What I would be interested in the most is to somehow debug or terminate the currently stalled process in a way that would generate something useful (e.g. a dump, etc.). I’ve got little idea how to do something like this on Windows, unfortunately.
Next time I have my hands on hardware with Windows 10 on it I’ll check it but this isn’t something I’ve seen before. Sysinternals’ Process Explorer can generate dumps of processes. I’m more accustomed to diagnosing memory crash dumps but I am happy to look at a process dump if you can get one. Keep in mind it’ll have things like API keys, HTTPS private key material etc. in it. You could set-up a separate test instance and keep it running; if that also suffers then you could send me a dump and it won’t have anything confidential in it.
Thank you very much for your help offer. I’ve finally come back to the question at hand, and I’ve also taken the dumps with Process Explorer. However, I’ve also installed and opened them with “Debugging Tools for Windows” first, and there’s quite a lot of information there that I’m not necessarily comfortable sharing, so I’ve decided to try running the debugger/analyser on my own.
This is the output of windbg.exe for the main syncthing.exe process.
Debug session time: Sat Feb  5 19:40:52.000 2022 (UTC + 1:00)
System Uptime: 12 days 3:47:53.671
Process Uptime: 6 days 3:27:03.000
...........................
For analysis of this file, run !analyze -v
eax=0000007f ebx=00000000 ecx=01b4f5d4 edx=77682750 esi=00000000 edi=01b4f628
eip=77682750 esp=01b4f5d4 ebp=01b4f64c iopl=0         nv up ei pl zr na pe cy
cs=001b  ss=0023  ds=0023  es=0023  fs=003b  gs=0000             efl=00000247
ntdll!KiFastSystemCallRet:
77682750 c3              ret
0:000> !analyze -v
*******************************************************************************
*                                                                             *
*                        Exception Analysis                                   *
*                                                                             *
*******************************************************************************

*** WARNING: Unable to verify timestamp for Syncthing.exe

KEY_VALUES_STRING: 1

    Key  : Analysis.CPU.mSec
    Value: 2421

    Key  : Analysis.DebugAnalysisManager
    Value: Create

    Key  : Analysis.Elapsed.mSec
    Value: 23961

    Key  : Analysis.Init.CPU.mSec
    Value: 3749

    Key  : Analysis.Init.Elapsed.mSec
    Value: 67244

    Key  : Analysis.Memory.CommitPeak.Mb
    Value: 76

    Key  : Timeline.OS.Boot.DeltaSec
    Value: 1050473

    Key  : Timeline.Process.Start.DeltaSec
    Value: 530823

    Key  : WER.OS.Branch
    Value: vb_release

    Key  : WER.OS.Timestamp
    Value: 2019-12-06T14:06:00Z

    Key  : WER.OS.Version
    Value: 10.0.19041.1

    Key  : WER.Process.Version
    Value: 1.18.6.0


NTGLOBALFLAG:  0

PROCESS_BAM_CURRENT_THROTTLED: 0

PROCESS_BAM_PREVIOUS_THROTTLED: 0

APPLICATION_VERIFIER_FLAGS:  0

EXCEPTION_RECORD:  (.exr -1)
ExceptionAddress: 00000000
   ExceptionCode: 80000003 (Break instruction exception)
  ExceptionFlags: 00000000
NumberParameters: 0

FAULTING_THREAD:  00000b14

PROCESS_NAME:  Syncthing.exe

ERROR_CODE: (NTSTATUS) 0x80000003 - {EXCEPTION}  Breakpoint  A breakpoint has been reached.

EXCEPTION_CODE_STR:  80000003

STACK_TEXT:
01b4f5d0 7767f60a     756dafd2 00000118 01b4f6fc ntdll!KiFastSystemCallRet
01b4f5d4 756dafd2     00000118 01b4f6fc 00000040 ntdll!NtRemoveIoCompletionEx+0xa
01b4f64c 00566ef5     00000118 01b4f6fc 00000040 KERNELBASE!GetQueuedCompletionStatusEx+0x82
WARNING: Stack unwind information not available. Following frames may be wrong.
01b4f688 756db008     756db025 005333f5 00566ed0 Syncthing+0x66ef5
01b4f6ec 00566ef5     00000118 0173b3a0 00000000 KERNELBASE!GetQueuedCompletionStatusEx+0xb8
00000000 00000000     00000000 00000000 00000000 Syncthing+0x66ef5


STACK_COMMAND:  ~0s; .ecxr ; kb

SYMBOL_NAME:  kernelbase!GetQueuedCompletionStatusEx+82

MODULE_NAME: KERNELBASE

IMAGE_NAME:  KERNELBASE.dll

FAILURE_BUCKET_ID:  BREAKPOINT_80000003_KERNELBASE.dll!GetQueuedCompletionStatusEx

OS_VERSION:  10.0.19041.1

BUILDLAB_STR:  vb_release

OSPLATFORM_TYPE:  x86

OSNAME:  Windows 10

IMAGE_VERSION:  10.0.19041.1466

FAILURE_ID_HASH:  {9ee8acbb-8b05-fc0f-684d-27495ffb8928}

Followup:     MachineOwner
---------
Below is another one for the monitor syncthing.exe process.
Normally it does restart. That time it didn’t. It’s not just that it didn’t restart though, but the process became completely unresponsive after the OS was resumed from hibernation, and that state lasted for 6 days (until I took the dumps, then killed the process and restarted Syncthing manually).
Yeah, it’s set to 1. The CPU on this device is weak, and some of the files are located on a slow storage too (i.e. an SD card), so I prefer to reduce the load and have only 1 folder being scanned at a time, just to be able to still use the thing while Syncthing is running.
Just for the record, normally there’re zero issues regarding accessing the Web GUI and the synchronisation in general. Everything is always very responsive, even when syncing a lot of files at a time. This particular issue only happened after the hibernation/resume cycle. Also, the database is located on the faster eMMC storage, and only some of the large folders on the slow SD card.
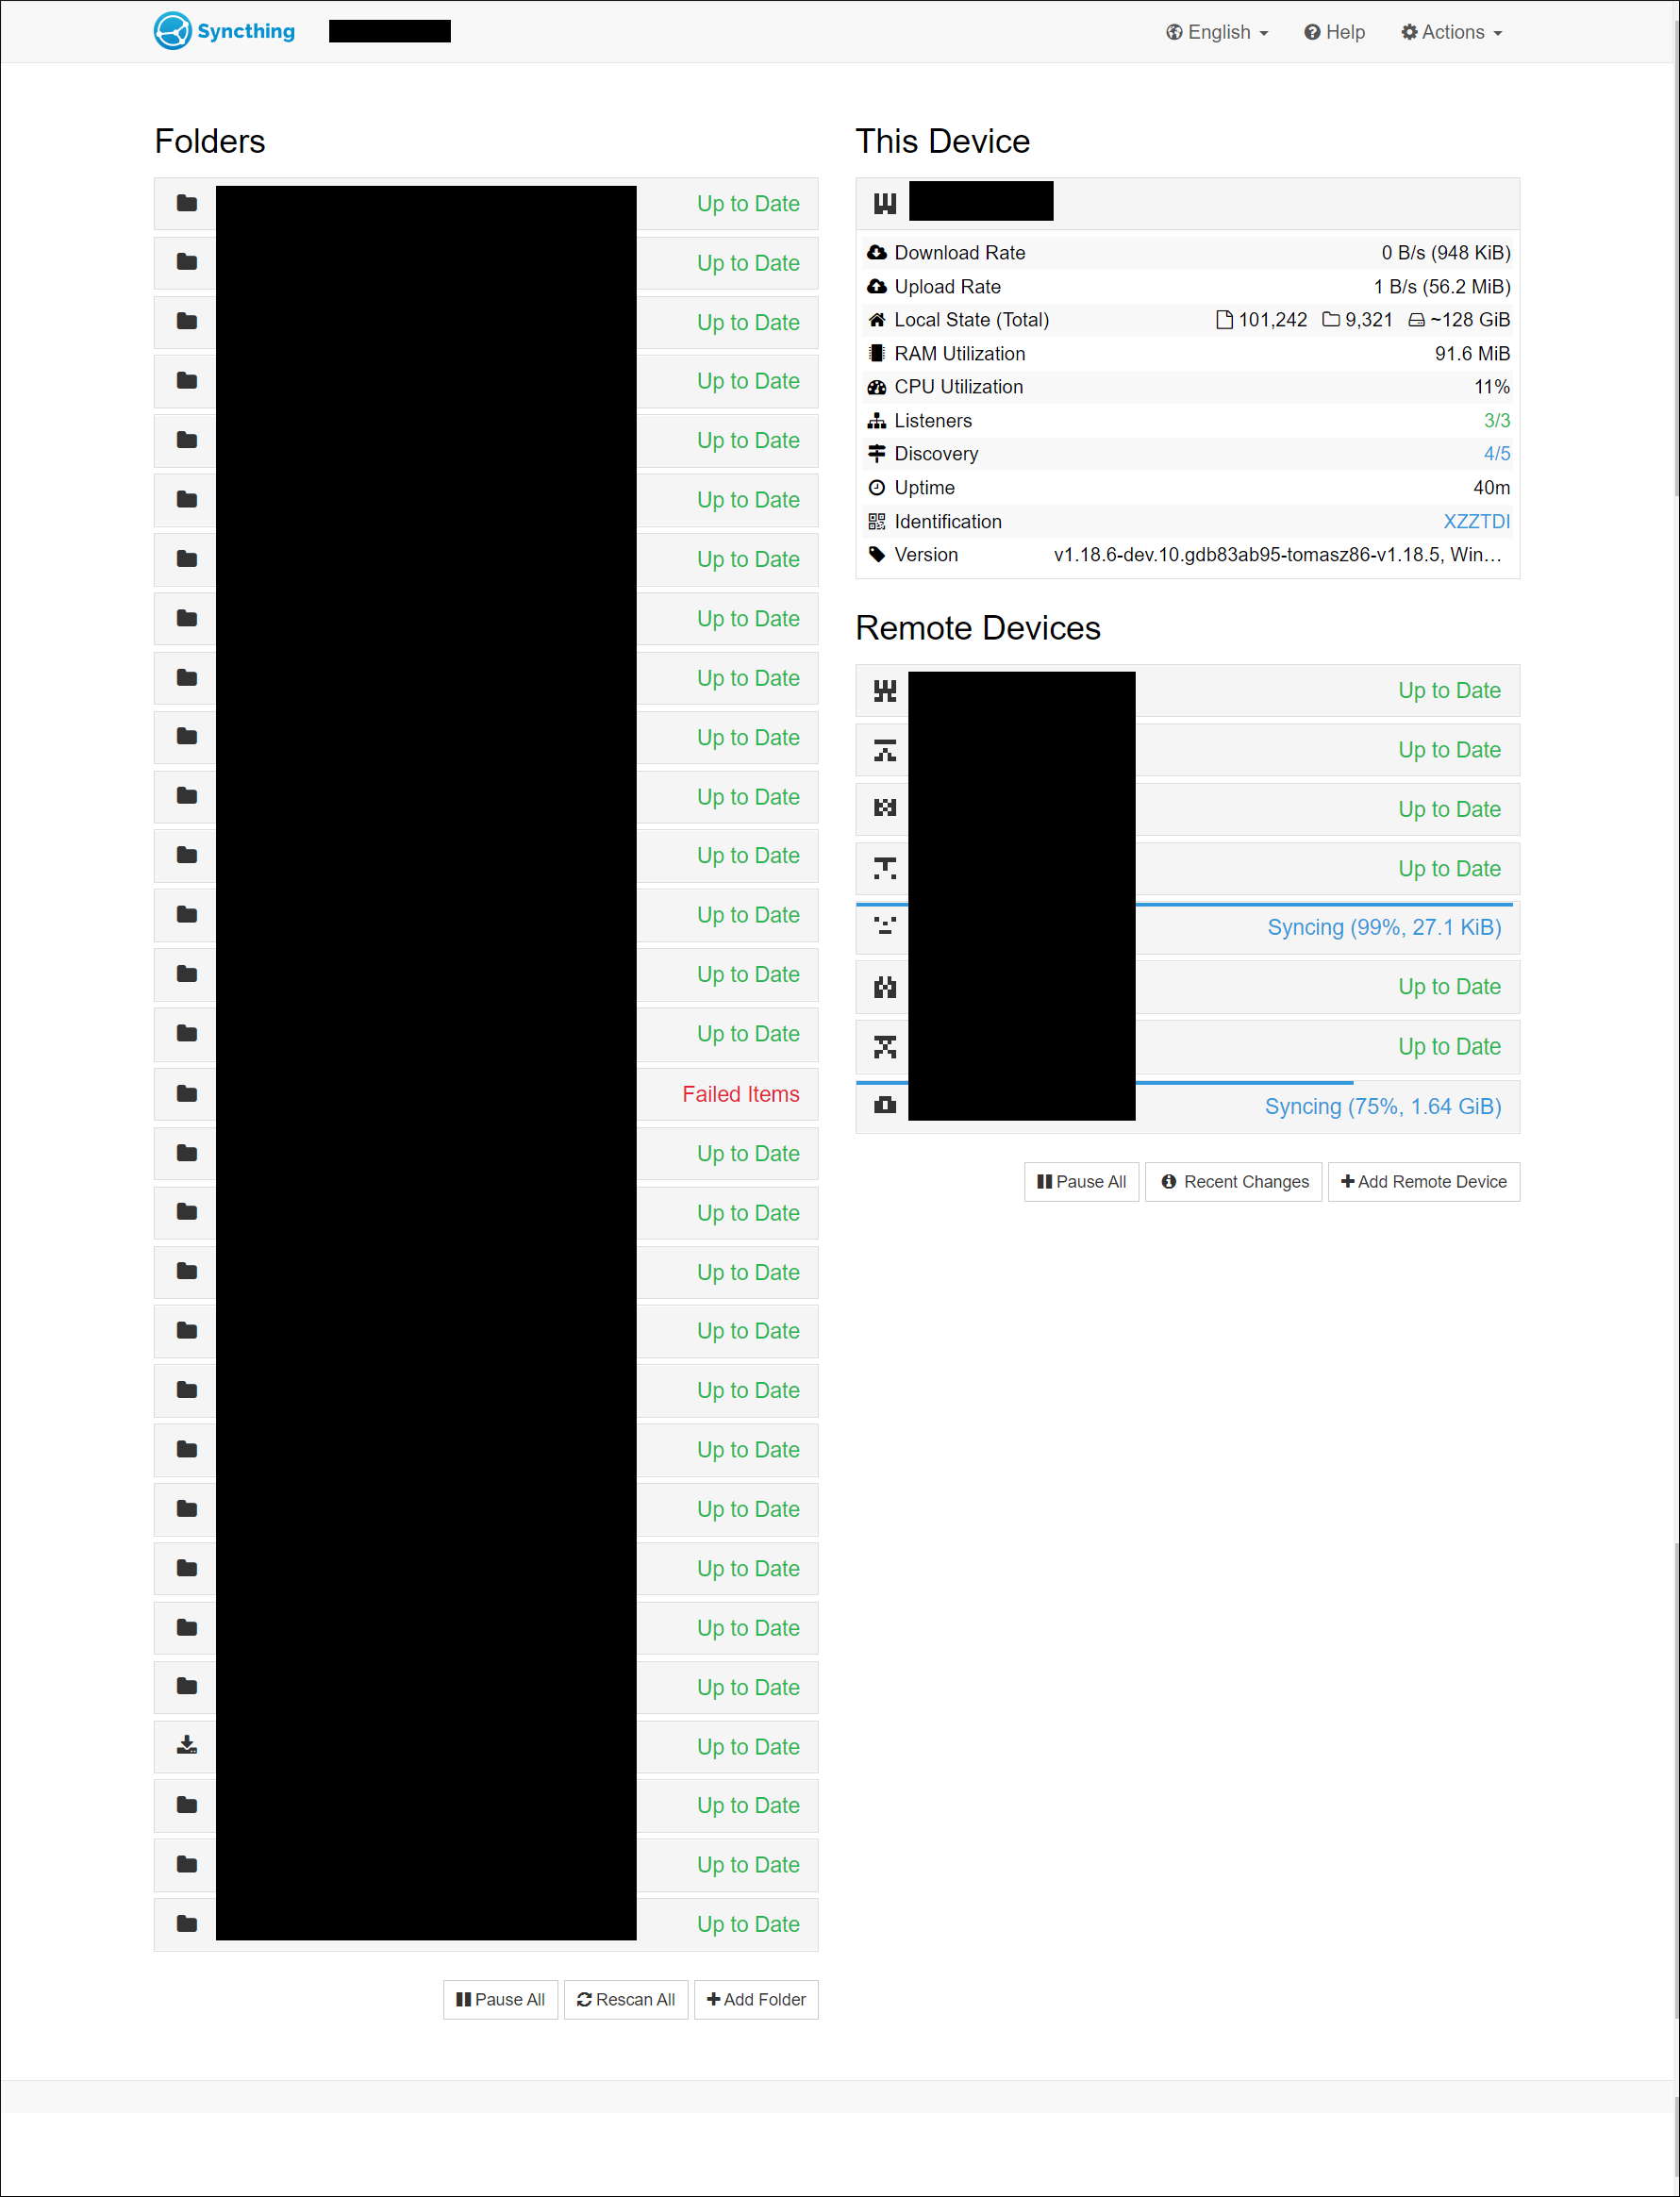
For the sake of completion, below is a screenshot from the Web GUI, showing the usual state when everything is working normally.
Yeah if you got only a single thread and that is blocked on io due to hibernation, there is no chance for the routine that does the “omg time jumped lets exit” to run.
I guess I am not sure how the web ui works in this case. (Edit, its not clear from your message that the ui worked post this lockup)
You either have to wait for the thread to unblock which for tcp could be hours, or run with more than a single thread.
Thanks for the tip. I will increase GOMAXPROCS to 2 then. Does this mean that a single-core system is essentially doomed when something similar happens there?
No, no, the Web GUI was completely inaccessible too. Everything Syncthing-related basically stopped working, except for the syncthing.exe processes still hanging there in the background.
Yeah I don’t think you can reliably run it with gomaxproc=1, to be honest, not sure if you can even run it with gomaxproc=2, as setting a limit I think (not sure) forces io to use runtime threads, where as if its not set it spawns a thread per io operation, so by setting it to 2, just means you’ll end up in the same situation if there are two io operations at the same time.
The number of cores has no relation to how that single core schedules threads.
You can have a single core and multiple threads and it will still work.
Does this mean that running Syncthing on a single-core machine with no GOMAXPROCS set is different than setting GOMAXPROCS to 1 on a multi-core one? I’ve always had the impression that the two lead to the same result.
Hmm, but wouldn’t that somewhat invalidate the current findings ?
If that’s the case, then something else must be the culprit here… I don’t think I tweak anything inside Syncthing itself that could possibly affect I/O or CPU performance though…
Just to reiterate, we’re talking about a situation where the process was stalled for 6 days straight (and would probably have stayed like that had I in the end not killed it manually).
I don’t see any findings other than you seeing process hangs. Many things could cause that, for example a database read or write taking “forever” for whatever reason.
What you could do is run with --debug-profiler-listen ($STPROFILER) and see if you can talk to the profiler when it’s hung. For example if you run it with STPROFILER=localhost:9090 you can get a goroutine trace at http://localhost:9090/debug/pprof/goroutine?debug=1. That would show what is wedged where.
If it’s dead enough that you can’t even talk to the profiler then your culprit is in the Go runtime or the OS, and we can’t help you any more.
“Findings” as in Audrius suggesting that GOMAXPROCS might be responsible for the process stall .
The profiler wasn’t turned on, unfortunately, so I couldn’t do anything else than to save the Windows process dumps. It is enabled now, so if the problem re-occurs, it should be ready. This isn’t something experienced on a regular basis though. I’ve probably seen similar stalls maybe a few times throughout my whole time of using Syncthing. I can, of course, try to repeatedly hibernate and resume the OS on purpose to possibly force it to happen.
Also, if we claim that go does spawn a thread per io operation, and the debug tool only dumps the entrypoint/main thread, why would go runtime do io on the main thread if it was spawning a thread per io operation?
I have no idea what the Windows debug thing purports to show, but I’m certain I/O threads don’t count under GOMAXPROCS. This is easily demonstrated by starting Syncthing with GOMAXPROCS=1 and seeing that it has 9 or so threads running (on my trival test setup).
 ?
?