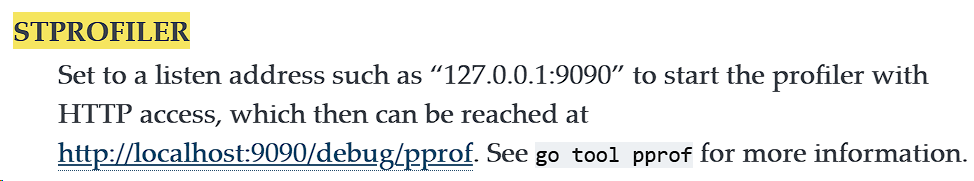
However, in the current version of the Docs, there is no mention of STPROFILER at all, even though the instructions themselves do still apply and work:
Mostly because most of these are now on the command line flags, including STPROFILER in fact:
      --debug-gui-assets-dir=PATH              Directory to load GUI assets from ($STGUIASSETS)
      --debug-perf-stats                       Write running performance statistics to perf-$pid.csv (Unix only) ($STPERFSTATS)
      --debug-profile-block                    Write block profiles to block-$pid-$timestamp.pprof every 20 seconds
                                               ($STBLOCKPROFILE)
      --debug-profile-cpu                      Write a CPU profile to cpu-$pid.pprof on exit ($STCPUPROFILE)
      --debug-profile-heap                     Write heap profiles to heap-$pid-$timestamp.pprof each time heap usage increases
                                               ($STHEAPPROFILE)
      --debug-profiler-listen=ADDR             Network profiler listen address ($STPROFILER)
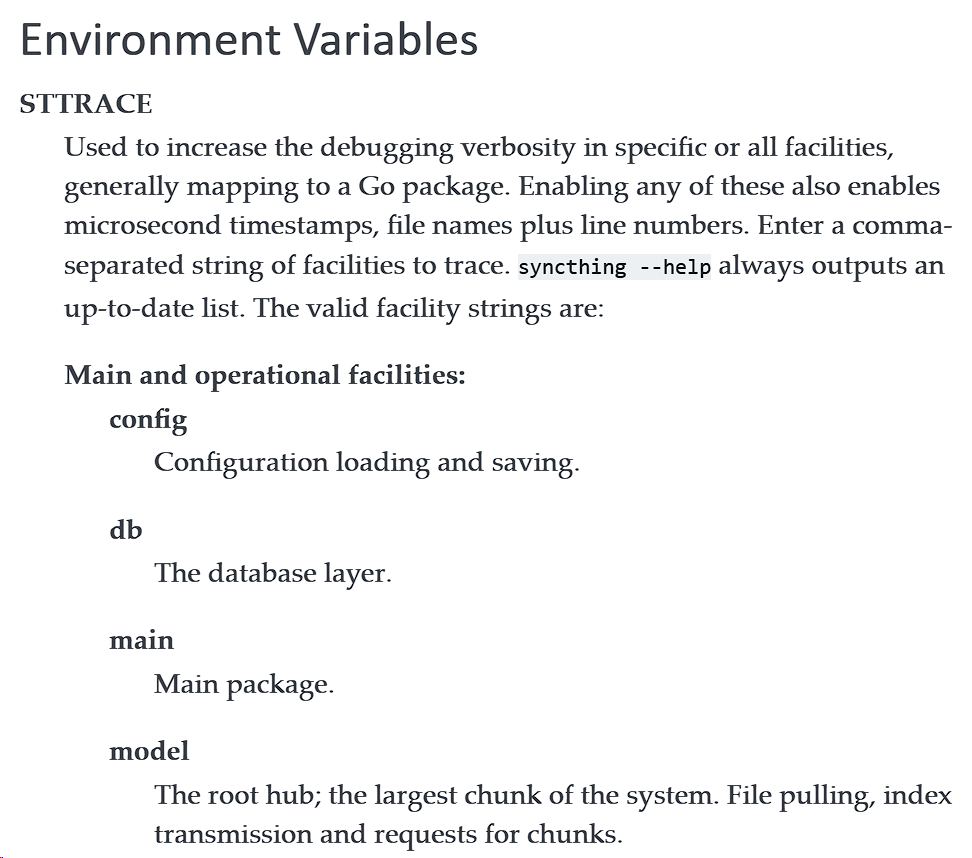
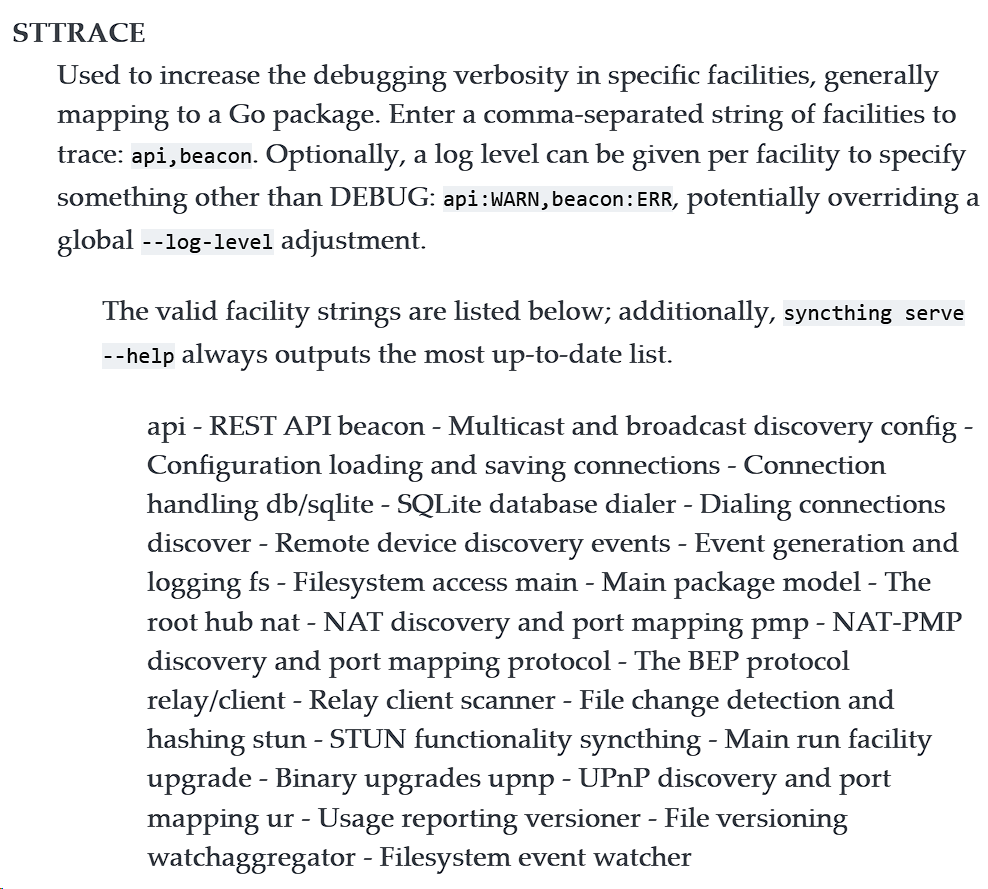
Ah, now it’s clear. I think all those could be added to https://docs.syncthing.net/users/syncthing.html, right? At the moment, there seems to be no documentation available at all (and wrappers like the Android app only allow setting environment variables).
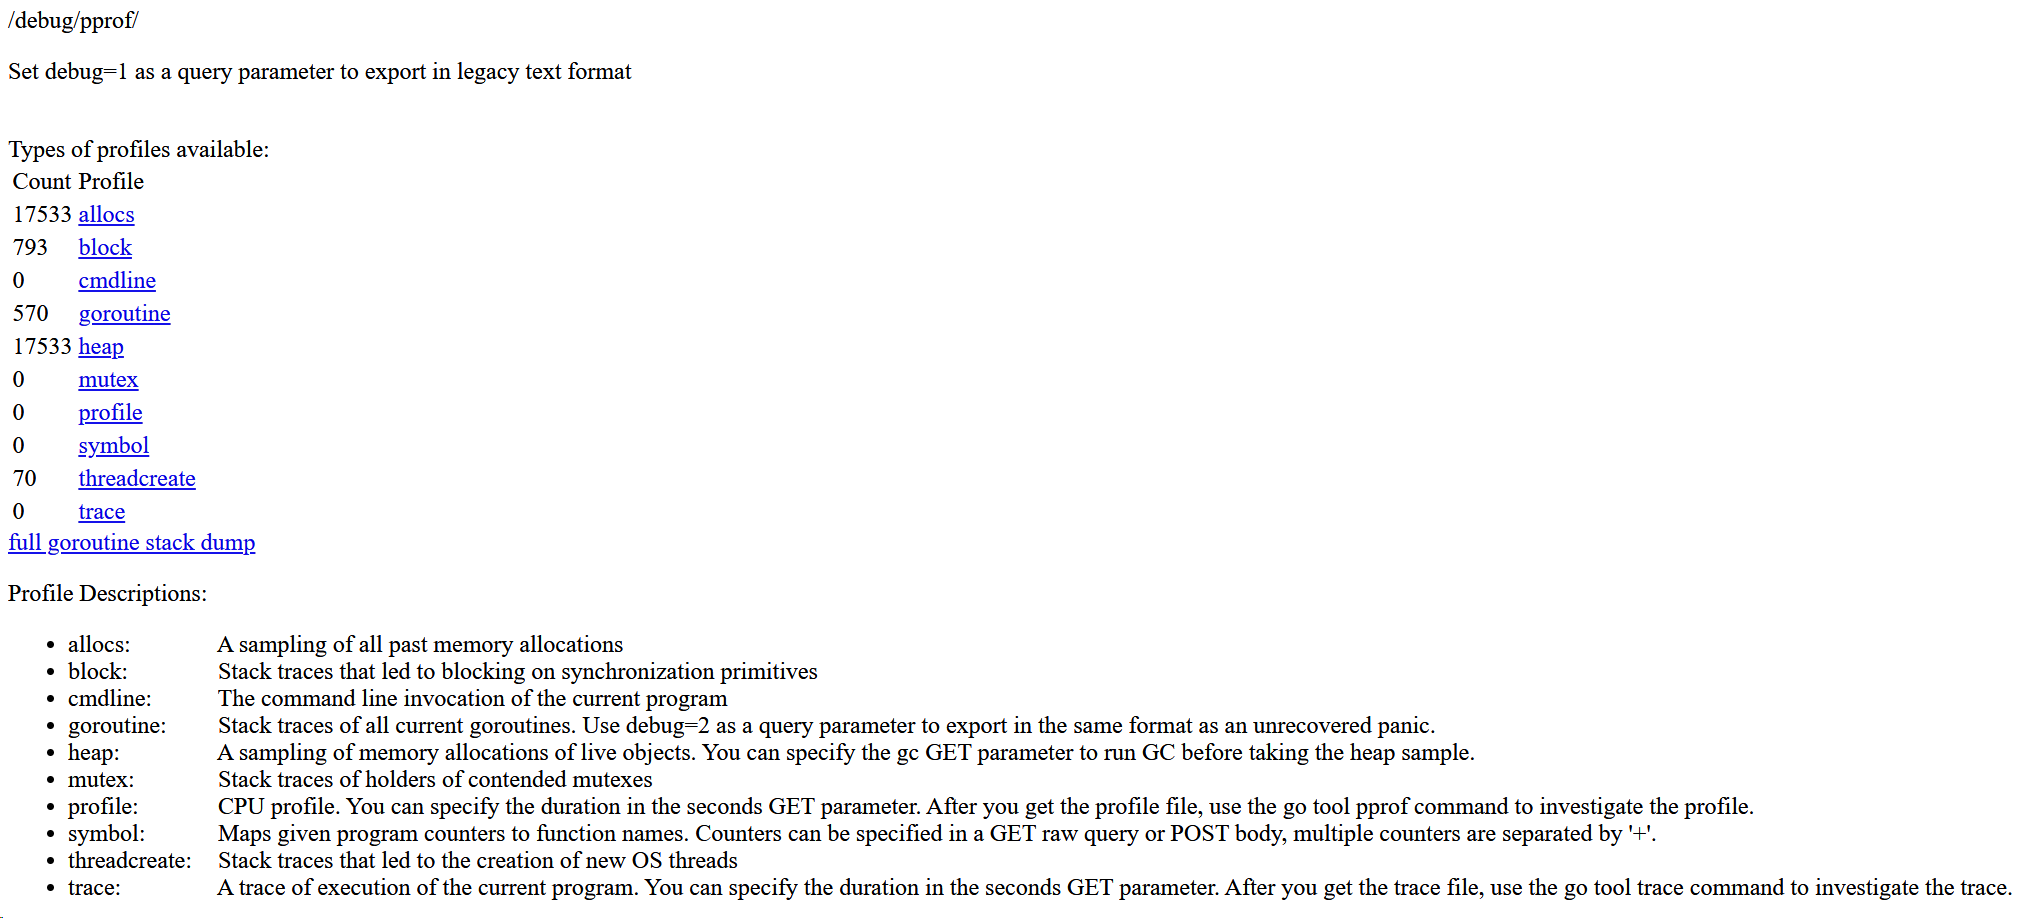
In the case of STPROFILER specifically, you still need to know the URL to access the debug page (which is different than the CPU and heap profiling URLs, i.e. there is no /rest/ in it).