Hello,
I have been encountering this issue for quite some time and I really don’t know what’s going on. Here are the basics.
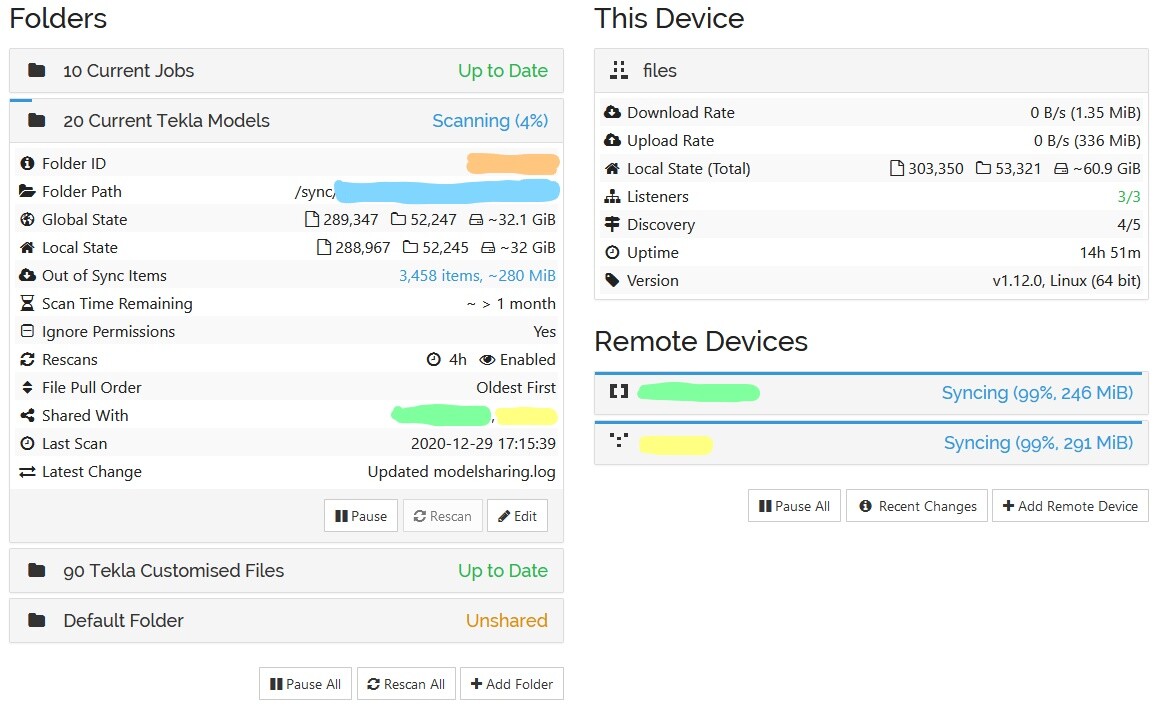
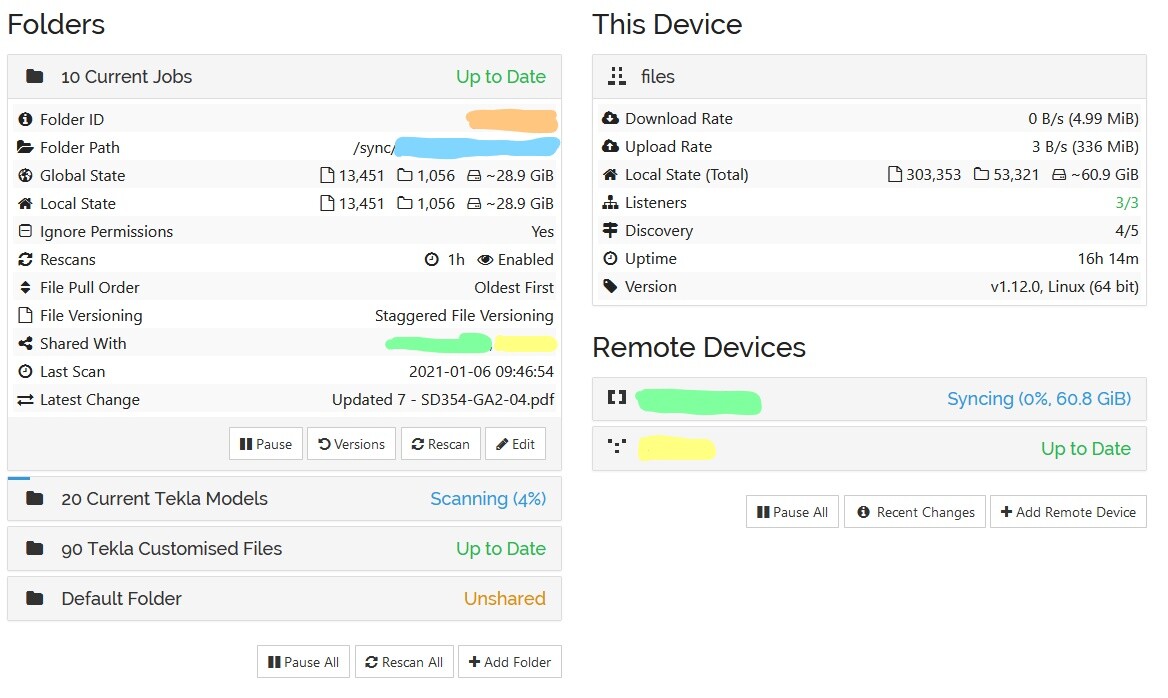
I have a 3 node set up. A server and two client machines. Here is a screenshot of the server’s webui.
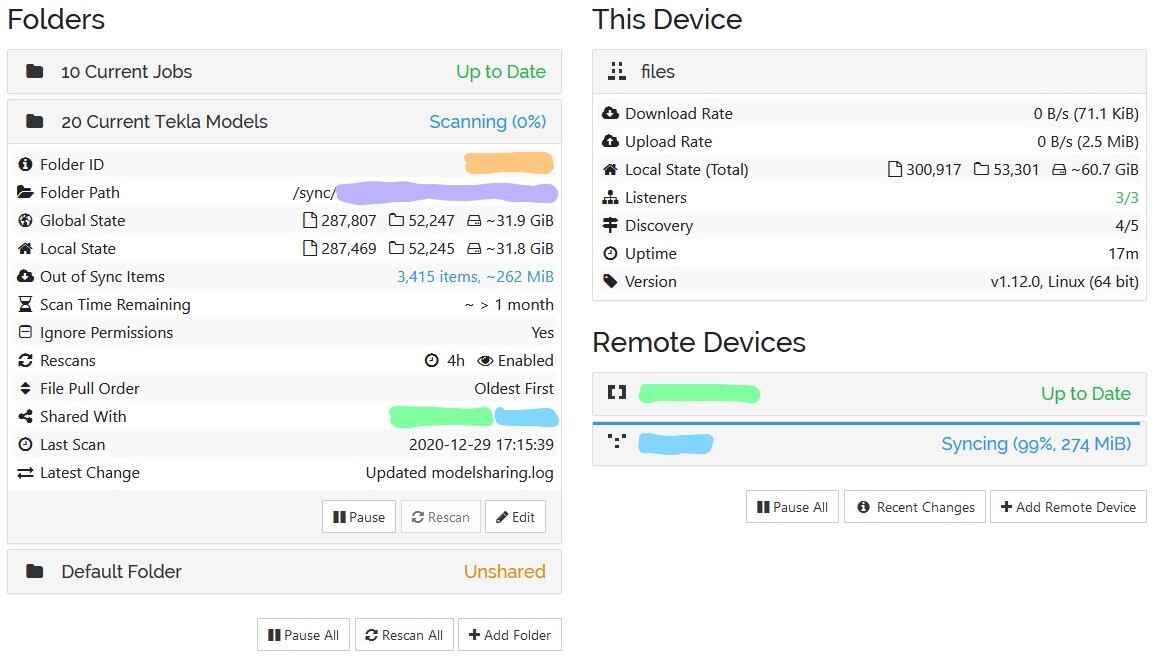
As you can see we deal with a lot of small files. These are primarily 1kb to 250kb in size and there are a lot of them, however they’re generally in a structure so there may be a max of 50 in a given folder. The joys of the old implementation of the potree point cloud format.
The server is running unRaid and SyncThing is running in the linuxserver/syncthing docker container. Files are stored on the xfs unraid array with 2 hdds.
My first thought was a bottleneck of some description, however CPU usage is always quite low and there is plenty of ram and the system isn’t swapping.
root@files ~ # free -m
              total        used        free      shared  buff/cache   available
Mem:          32145        5767       16294        1022       10084       24998
Swap:             0           0           0
top - 12:02:28 up 33 min,  2 users,  load average: 1.96, 2.47, 2.61
Tasks: 373 total,   1 running, 372 sleeping,   0 stopped,   0 zombie
%Cpu(s):  7.8 us, 10.0 sy,  0.9 ni, 80.7 id,  0.0 wa,  0.0 hi,  0.5 si,  0.0 st
MiB Mem :  32145.5 total,  16250.8 free,   5771.4 used,  10123.3 buff/cache
MiB Swap:      0.0 total,      0.0 free,      0.0 used.  24994.5 avail Mem

  PID USER      PR  NI    VIRT    RES    SHR S  %CPU  %MEM     TIME+ COMMAND
 8097 root      20   0 1040988  96956   1032 S  47.9   0.3  18:04.56 shfs
 9327 root      20   0 4689708   4.1g  22112 S  44.6  13.1  33:23.88 qemu-system-x86
13995 nobody    31  11 1072924 336532  17976 S  27.1   1.0   9:39.04 syncthing
 8358 root      20   0 1066080  75988  42468 S   4.3   0.2   1:48.57 dockerd
 8375 root      20   0 1044508  33504  18276 S   3.6   0.1   1:06.56 containerd
28818 root      20   0  151228  37860  27040 S   2.6   0.1   0:00.08 docker
 7830 root      20   0  283592   4116   3460 S   1.0   0.0   0:12.62 emhttpd
28519 root      20   0    7032   3360   2524 R   0.7   0.0   0:00.08 top
   53 root      20   0       0      0      0 I   0.3   0.0   0:01.62 kworker/4:1-events
 7649 root      20   0  109104  10264   3892 S   0.3   0.0   0:04.69 containerd-shim
 9227 root      20   0  109104  10324   3956 S   0.3   0.0   0:07.70 containerd-shim
 9521 root      20   0    3856   2464   2200 S   0.3   0.0   0:00.71 docker_load
12072 root      20   0  109104  10324   3956 S   0.3   0.0   0:07.23 containerd-shim
13615 root      20   0  109104  10324   3956 S   0.3   0.0   0:11.85 containerd-shim
17587 root      20   0  109104  11096   4544 S   0.3   0.0   0:06.82 containerd-shim
18352 nobody    20   0 2031168 134088  22628 S   0.3   0.4   0:01.71 mysqld
The above statistics were taken while hashing was running and nothing looks like it’s being pushed hard. Next thought was disk IO bottleneck of some description.
root@files ~ # iostat -m
Linux 4.19.98-Unraid (files)    01/05/2021      _x86_64_        (8 CPU)

avg-cpu:  %user   %nice %system %iowait  %steal   %idle
          13.55    1.12   12.52    2.67    0.00   70.14

Device             tps    MB_read/s    MB_wrtn/s    MB_dscd/s    MB_read    MB_wrtn    MB_dscd
loop0             1.36         0.00         0.00         0.00          3          0          0
loop1             0.02         0.00         0.00         0.00          0          0          0
loop2             8.39         0.23         0.15         0.00        502        332          0
loop3             0.04         0.00         0.00         0.00          1          0          0
md1               9.82         0.13         0.00         0.00        276          2          0
sda               0.62         0.06         0.02         0.00        134         49          0
sdb               0.74         0.01         0.01         0.00         30         25          0
sdc               0.67         0.01         0.01         0.00         25         25          0
sdd               0.06         0.00         0.00         0.00          3          2          0
sde               9.52         0.13         0.00         0.00        278          2          0
sdf             113.02         1.65         4.95         0.00       3632      10923          0
sdg             100.69         0.47         4.95         0.00       1041      10923          0
From what I could find, the tps value points towards a fairly heavy IOPS for the spinning rust disks. However, it’s possible I’m interpreting those results incorrectly.
I also enabled STTRACE=scanner and here is an excerpt of the log.
root@files ~ # cat syncthing_redacted.log
[IDID_0] 2021/01/05 12:09:34.642662 walk.go:171: DEBUG: Walk FOLDER_ID_1 [] current progress 1318514/3476255146 at 0.0 MiB/s (0%)
[IDID_0] 2021/01/05 12:09:36.643536 walk.go:171: DEBUG: Walk FOLDER_ID_1 [] current progress 1318514/3476255146 at 0.0 MiB/s (0%)
[IDID_0] 2021/01/05 12:09:38.641049 walk.go:171: DEBUG: Walk FOLDER_ID_1 [] current progress 1318514/3476255146 at 0.0 MiB/s (0%)
[IDID_0] 2021/01/05 12:09:40.642674 walk.go:171: DEBUG: Walk FOLDER_ID_1 [] current progress 1318514/3476255146 at 0.0 MiB/s (0%)
[IDID_0] 2021/01/05 12:09:40.923316 walk.go:187: DEBUG: real to hash: SD340 GSSC Handrails & Balustrades/PointClouds/201229 A3 Wing 1 25M.potree/data/r/60255/r60255.bin
[IDID_0] 2021/01/05 12:09:40.923824 walk.go:187: DEBUG: real to hash: SD340 GSSC Handrails & Balustrades/PointClouds/201229 A3 Wing 1 25M.potree/data/r/60255/r60255.hrc
[IDID_0] 2021/01/05 12:09:40.926027 walk.go:187: DEBUG: real to hash: SD340 GSSC Handrails & Balustrades/PointClouds/201229 A3 Wing 1 25M.potree/data/r/60256/r60256.bin
[IDID_0] 2021/01/05 12:09:42.643804 walk.go:171: DEBUG: Walk FOLDER_ID_1 [] current progress 1374860/3476255146 at 0.0 MiB/s (0%)
[IDID_0] 2021/01/05 12:09:44.642547 walk.go:171: DEBUG: Walk FOLDER_ID_1 [] current progress 1374860/3476255146 at 0.0 MiB/s (0%)
[IDID_0] 2021/01/05 12:09:46.641152 walk.go:171: DEBUG: Walk FOLDER_ID_1 [] current progress 1374860/3476255146 at 0.0 MiB/s (0%)
Lots of the current progress lines randomly interspersed with a real to hash line. There’s usually around 2.5 minutes between each real to hash line, which doesn’t seem correct to hash a small file.
Any assistance on this issue would be greatly appreciated. Unfortunately these files have to be synced, so ignoring them isn’t really an option.
Thank you.