Now this one operated completely different. It did lots and lots of the normal stuff, pretty much all like the old logs,but then the logs changed, to a point were the old stuff scrolls off the screen and I’m left with what you see in the pastebin, THEN, syncthing stops and SYncTrayor gives me the option to ‘Start Syncthing’
10 Mins worth of logs, bear in mind, currently one of my Windows 10 machines is not turned on, so the only two are the main location point I’d like to keep my files (windows 7) and my windows 10 machine that was having issues (you were led to believe) as it has virtual adapters.
During this 10 mins, I had/have created a folder within the SC folder (SC stands for Source Code) and watched it, the Synthing/SyncTrayor on the windows 10 machine is scanning the SC (Scanning/Scanning 0%/Up To Date) and saying it’s ‘UpToDate’ but I know (after checking the Windows 7 machine) it’s not Syncing that recently created folder with it.
This is a panic, but its not long enough to understand where it happened.
Well, I’ve just opened it back up, as it’s stopped again, I’m unable to see any decent logs.
I’m wondering if it’s because I’m using the AMD64 not the x86 version of Syncthing? I am on a 64 bit machine, but it’s intel.
Anything I can find, logs or something so you can see why it’s dying?
Well we’d need the full log to be able to tell what has casaused the crash. You can launch it via terminal and redirect the output to file, if whatever way you are getting logs does not scroll back enough.
@peejaygee: Go to File -> Settings -> Syncthing and add -logfile="some\path\to\a\log\file.txt to “Syncthing Command-line Flags”
The next release of SyncTrayzor will have much better support for dealing with Syncthing’s logging, but I’m not entirely sure it will handle intermediate builds of Syncthing properly so I’m not recommending it here just yet…
Added the commandline flags and started it back up, I’ll remote into my home machine from work later and see if it’s died again and see if any logs have been generated and then copy them into pastebin again.
I’ve added in the Syncthing -command line flags on the middle tab on the settings.
-logfile=G:\file.txt {with a without quotes, adding the quotes, it just removes them)
but I don’t see a file.txt being generated on my root of G.
What am I missing?
Ack, sorry. Syncthing will be ignoring that flag, as it’s running without a monitor.
I’ve fixed up the dev build of SyncTrayzor to properly handle intermediate builds of Syncthing. You’ll be able to download it from here when it’s finished building: https://ci.appveyor.com/project/canton7/synctrayzor/build/1.0.32.202/artifacts.
There are a bunch of logging settings in File -> Settings -> Logging + STTRACE.
Ok, all installed, sub menu visible.
What options would you like me ticked and unticked?
Tick whichever STTRACE values Audrius asked you to select (they should be ticked already). There’s also now a Syncthing log file, which is the important bit.
Right, all set, just gonna leave it now for a little while until it closes down again, then I’ll get the logs together and upload and share.
Ok, so (and I’m not blaming this on anything sync related) I just had a blue screen, so when I restarted the machine, I zipped up the logs I have, you can get them from
http://www.pjg-developments.com/synct/logs.zip
Easier than using pastebin for a ‘huge’ file.
Hope this helps.
It seems stuck connecting, can you make sure it’s whitelisted and allowed through by the firewall? There should have been a firewall prompt I guess.
I’ve got syncthing configured in both comodo and windows own firewall (I always believed that most 3rd party firewalls override windows firewall, but I wanted to be safe)
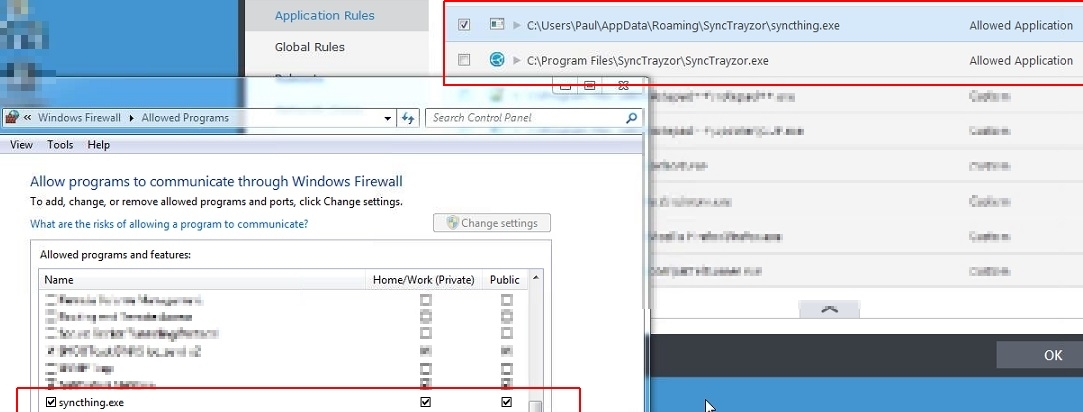

Unless I’m missing something blatantly obvious, I even open port 22000 at one point, just to be sure.
Do you have an external firewall? Because its definitely crashing as its failing to open a socket, and that’s most likely the cause of the original problem.
Did you try disabling all firewalls? Do you have external ones?
For the record the panic is (top routine the culprit):
1: IO wait [27 minutes] [Created by protocol.(*rawConnection).Start @ protocol.go:190]
    net         netpoll.go:157            runtime_pollWait(#14, 0x72, #152)
    net         fd_poll_runtime.go:73     (*pollDesc).Wait(#136, 0x72, 0, 0)
    net         fd_windows.go:182         (*ioSrv).ExecIO(#114, #134, 0xb94fa8, 0x7, 0xcdaaf8, 0x2000, 0, 0)
    net         fd_windows.go:463         (*netFD).Read(#133, #82, 0x403a, 0x403a, 0, 0, 0)
    net         net.go:172                (*conn).Read(#81, #82, 0x403a, 0x403a, 0, 0, 0)
    tls         conn.go:455               (*block).readFromUntil(#122, #24, #81, 0x401d, 0, 0)
    tls         conn.go:583               (*Conn).readRecord(#142, 0xcdb217, 0, 0)
    tls         conn.go:901               (*Conn).Read(#142, #169, 0x8fae, 0x8fae, 0, 0, 0)
    protocol    counting.go:23            (*countingReader).Read(#162, #169, 0x8fae, 0x8fae, 0x4000, 0, 0)
    io          io.go:298                 ReadAtLeast(#29, #162, #168, 0x10fa6, 0x10fa6, 0x10fa6, 0x7ff8, 0, 0)
    io          io.go:316                 ReadFull(#29, #162, #168, 0x10fa6, 0x10fa6, 0x10fa6, 0, 0)
    protocol    protocol.go:396           (*rawConnection).readMessage(#69, 0, 0x2, 0x1, #175, 0, 0, 0, 0)
    protocol    protocol.go:307           (*rawConnection).readerLoop(#69, 0, 0)
1: running [Created by model.deadlockDetect @ util.go:35]
    model       util.go:32                deadlockDetect.func1(#2, 0x307a550, #1)
1: semacquire [Created by http.(*Server).Serve @ server.go:1910]
    sync        sema.go:237               runtime_Syncsemacquire(#33)
    sync        cond.go:62                (*Cond).Wait(#32)
    events      events.go:277             (*BufferedSubscription).Since(#36, 0x22d, 0, 0, 0, 0, 0, 0)
    main        gui.go:851                (*apiSvc).getEvents(#42, #23, #78, #71)
    main        gui.go:144                (*apiSvc).(main.getEvents)-fm(#23, #78, #71)
    http        server.go:1422            HandlerFunc.ServeHTTP(#105, #23, #78, #71)
    http        server.go:1699            (*ServeMux).ServeHTTP(#93, #23, #78, #71)
    main        gui.go:290                getPostHandler.func1(#23, #78, #71)
    http        server.go:1422            HandlerFunc.ServeHTTP(#94, #23, #78, #71)
    main        gui.go:329                metricsMiddleware.func1(#23, #78, #71)
    http        server.go:1422            HandlerFunc.ServeHTTP(#64, #23, #78, #71)
    main        gui.go:356                noCacheMiddleware.func1(#23, #78, #71)
    http        server.go:1422            HandlerFunc.ServeHTTP(#65, #23, #78, #71)
    http        server.go:1699            (*ServeMux).ServeHTTP(#95, #23, #78, #71)
    main        gui_csrf.go:31            csrfMiddleware.func1(#23, #78, #71)
    http        server.go:1422            HandlerFunc.ServeHTTP(#73, #23, #78, #71)
    main        gui.go:364                withDetailsMiddleware.func1(#23, #78, #71)
    http        server.go:1422            HandlerFunc.ServeHTTP(#92, #23, #78, #71)
    main        gui.go:346                redirectToHTTPSMiddleware.func1(#23, #78, #71)
    http        server.go:1422            HandlerFunc.ServeHTTP(#66, #23, #78, #71)
    main        gui.go:302                debugMiddleware.func1(#23, #78, #71)
    http        server.go:1422            HandlerFunc.ServeHTTP(#67, #23, #78, #71)
    http        server.go:1862            serverHandler.ServeHTTP(#75, #23, #78, #71)
    http        server.go:1361            (*conn).serve(#76)
8: semacquire [14 minutes] [Created by http.(*Server).Serve @ server.go:1910]
    sync        sema.go:43                runtime_Semacquire(#54)
    sync        rwmutex.go:36             (*RWMutex).RLock(#1)
    model       model.go:310              (*Model).ConnectionStats(#129, 0xc1d519)
    main        gui.go:537                (*apiSvc).getSystemConnections(#42, #23, *, *)
    main        gui.go:153                (*apiSvc).(main.getSystemConnections)-fm(#23, *, *)
    http        server.go:1422            HandlerFunc.ServeHTTP(#106, #23, *, *)
    http        server.go:1699            (*ServeMux).ServeHTTP(#93, #23, *, *)
    main        gui.go:290                getPostHandler.func1(#23, *, *)
    http        server.go:1422            HandlerFunc.ServeHTTP(#94, #23, *, *)
    main        gui.go:329                metricsMiddleware.func1(#23, *, *)
    http        server.go:1422            HandlerFunc.ServeHTTP(#64, #23, *, *)
    main        gui.go:356                noCacheMiddleware.func1(#23, *, *)
    http        server.go:1422            HandlerFunc.ServeHTTP(#65, #23, *, *)
    http        server.go:1699            (*ServeMux).ServeHTTP(#95, #23, *, *)
    main        gui_csrf.go:31            csrfMiddleware.func1(#23, *, *)
    http        server.go:1422            HandlerFunc.ServeHTTP(#73, #23, *, *)
    main        gui.go:364                withDetailsMiddleware.func1(#23, *, *)
    http        server.go:1422            HandlerFunc.ServeHTTP(#92, #23, *, *)
    main        gui.go:346                redirectToHTTPSMiddleware.func1(#23, *, *)
    http        server.go:1422            HandlerFunc.ServeHTTP(#66, #23, *, *)
    main        gui.go:302                debugMiddleware.func1(#23, *, *)
    http        server.go:1422            HandlerFunc.ServeHTTP(#67, #23, *, *)
    http        server.go:1862            serverHandler.ServeHTTP(#75, #23, *, *)
    http        server.go:1361            (*conn).serve(*)
1: semacquire [6 minutes] [Created by suture.(*Supervisor).runService @ suture.go:559]
    sync        sema.go:43                runtime_Semacquire(#54)
    sync        rwmutex.go:36             (*RWMutex).RLock(#1)
    model       model.go:877              (*Model).ConnectedTo(#129, 0xdbefa951cd7b988d, #179, #178, 0xb68de2b509188ee5, #177)
    main        summarysvc.go:179         (*folderSummarySvc).sendSummary(#111, #58, 0x2)
    main        summarysvc.go:122         (*folderSummarySvc).calculateSummaries(#111)
    main        summarysvc.go:51          (*folderSummarySvc).(main.calculateSummaries)-fm()
    main        summarysvc.go:205         serviceFunc.Serve(#107)
    suture      suture.go:556             (*Supervisor).runService.func1(#138, 0x1, #21, #107)
1: semacquire [21 minutes] [Created by protocol.(*rawConnection).close.func1 @ protocol.go:688]
    sync        sema.go:43                runtime_Semacquire(#144)
    sync        mutex.go:82               (*Mutex).Lock(#143)
    tls         conn.go:684               (*Conn).sendAlert(#142, 0xcdb200, 0, 0)
    tls         conn.go:950               (*Conn).Close(#142, 0, 0)
    model       <autogenerated>:15        (*Connection).Close(#84, 0, 0)
    model       model.go:2015             closeRawConn(#30, #84, 0, 0)
    model       model.go:741              (*Model).Close(#129, 0xb72f598f5611049c, #176, 0xa1cd8f9b00e9dacf, 0x9da5b8dc589249fa, #4, #37)
    protocol    nativemodel_windows.go:47 nativeModel.Close(#28, #129, 0xb72f598f5611049c, #176, 0xa1cd8f9b00e9dacf, 0x9da5b8dc589249fa, #4, #37)
    protocol    <autogenerated>:98        (*nativeModel).Close(#80, 0xb72f598f5611049c, #176, 0xa1cd8f9b00e9dacf, 0x9da5b8dc589249fa, #4, #37)
1: IO wait [2 minutes] [Created by client.(*staticClient).Serve @ static.go:99]
    net         netpoll.go:157            runtime_pollWait(#22, 0x72, #171)
    net         fd_poll_runtime.go:73     (*pollDesc).Wait(#89, 0x72, 0, 0)
    net         fd_windows.go:182         (*ioSrv).ExecIO(#114, #88, 0xb94fa8, 0x7, 0xcdaaf8, 0x29, 0, 0)
    net         fd_windows.go:463         (*netFD).Read(#87, #121, 0x400, 0x400, 0, 0, 0)
    net         net.go:172                (*conn).Read(#77, #121, 0x400, 0x400, 0, 0, 0)
    tls         conn.go:455               (*block).readFromUntil(#83, #24, #77, 0x5, 0, 0)
    tls         conn.go:540               (*Conn).readRecord(#158, 0xcdb217, 0, 0)
    tls         conn.go:901               (*Conn).Read(#158, #86, 0x4, 0x8, 0, 0, 0)
    io          io.go:298                 ReadAtLeast(#26, #158, #86, 0x4, 0x8, 0x4, 0, 0, 0)
    io          io.go:316                 ReadFull(#26, #158, #86, 0x4, 0x8, 0x4, 0, 0)
    xdr         reader.go:111             (*Reader).ReadUint32(#85, 0)
    protocol    packets_xdr.go:80         (*header).DecodeXDRFrom(#68, #85, 0, 0)
    protocol    packets_xdr.go:70         (*header).DecodeXDR(#68, #26, #158, 0, 0)
    protocol    protocol.go:77            ReadMessage(#26, #158, 0, 0, 0, 0)
    client      static.go:291             messageReader(#25, #158, #108, #109)
1: chan receive [145 minutes] [Created by suture.(*Supervisor).runService @ suture.go:559]
    connections connections.go:423        (*connectionSvc).acceptRelayConns(#127)
    connections connections.go:132        acceptRelayConns)-fm()
    connections connections.go:477        serviceFunc.Serve(#103)
    suture      suture.go:556             (*Supervisor).runService.func1(#137, 0x3, #20, #103)
1: IO wait [28 minutes] [Created by suture.(*Supervisor).runService @ suture.go:559]
    net         netpoll.go:157            runtime_pollWait(#15, 0x72, #79)
    net         fd_poll_runtime.go:73     (*pollDesc).Wait(#132, 0x72, 0, 0)
    net         fd_windows.go:182         (*ioSrv).ExecIO(#114, #131, 0xb9fa70, 0x8, #161, #125, 0, 0)
    net         fd_windows.go:564         (*netFD).acceptOne(#130, #38, 0x2, 0x2, #131, 0, 0, 0)
    net         fd_windows.go:594         (*netFD).accept(#130, 0, 0, 0)
    net         tcpsock_posix.go:254      (*TCPListener).AcceptTCP(#118, 0x97ad00, 0, 0)
    net         tcpsock_posix.go:264      (*TCPListener).Accept(#118, 0, 0, 0, 0)
    connections connections_tcp.go:70     tcpListener(#113, #43, #53)
    connections connections.go:126        NewConnectionSvc.func1()
    connections connections.go:477        serviceFunc.Serve(#63)
    suture      suture.go:556             (*Supervisor).runService.func1(#137, 0x1, #20, #63)
1: IO wait [2 minutes] [Created by suture.(*Supervisor).runService @ suture.go:559]
    net         netpoll.go:157            runtime_pollWait(#17, 0x72, #170)
    net         fd_poll_runtime.go:73     (*pollDesc).Wait(#98, 0x72, 0, 0)
    net         fd_windows.go:182         (*ioSrv).ExecIO(#114, #97, 0xb9fa70, 0x8, #165, #60, 0, 0)
    net         fd_windows.go:564         (*netFD).acceptOne(#96, #145, 0x2, 0x2, #97, 0xaf4340, 0, 0)
    net         fd_windows.go:594         (*netFD).accept(#96, 0, 0, 0)
    net         tcpsock_posix.go:254      (*TCPListener).AcceptTCP(#116, 0x452af5, 0, 0)
    net         tcpsock_posix.go:264      (*TCPListener).Accept(#116, 0, 0, 0, 0)
    tlsutil     tlsutil.go:128            (*DowngradingListener).AcceptNoWrapTLS(#62, 0, 0, #27, 0, 0)
    tlsutil     tlsutil.go:109            (*DowngradingListener).Accept(#62, 0, 0, 0, 0)
    http        server.go:1887            (*Server).Serve(#75, #18, #62, 0, 0)
    main        gui.go:233                (*apiSvc).Serve(#42)
    suture      suture.go:556             (*Supervisor).runService.func1(#45, 0x4, #19, #42)
1: chan receive [Created by suture.(*Supervisor).runService @ suture.go:559]
    beacon      multicast.go:108          (*multicastWriter).Serve(#91)
    suture      suture.go:556             (*Supervisor).runService.func1(#52, 0x1, #12, #91)
1: select [25 minutes] [Created by suture.(*Supervisor).runService @ suture.go:559]
    discover    global.go:186             (*globalClient).Serve(#57)
    suture      suture.go:556             (*Supervisor).runService.func1(#48, 0x4, #9, #57)
1: select [25 minutes] [Created by suture.(*Supervisor).runService @ suture.go:559]
    discover    global.go:186             (*globalClient).Serve(#55)
    suture      suture.go:556             (*Supervisor).runService.func1(#48, 0, #9, #55)
1: select [25 minutes] [Created by suture.(*Supervisor).runService @ suture.go:559]
    discover    global.go:186             (*globalClient).Serve(#56)
    suture      suture.go:556             (*Supervisor).runService.func1(#48, 0x2, #9, #56)
1: select [25 minutes] [Created by suture.(*Supervisor).runService @ suture.go:559]
    main        upnpsvc.go:67             (*upnpSvc).Serve(#140)
    suture      suture.go:556             (*Supervisor).runService.func1(#45, 0x1, #5, #140)
1: select [Created by suture.(*Supervisor).runService @ suture.go:559]
    relay       relay.go:248              (*eventBroadcaster).Serve(#59)
    suture      suture.go:556             (*Supervisor).runService.func1(#47, 0x2, #7, #59)
1: select [145 minutes] [Created by suture.(*Supervisor).runService @ suture.go:559]
    relay       relay.go:198              (*invitationReceiver).Serve(#61)
    suture      suture.go:556             (*Supervisor).runService.func1(#47, 0x1, #6, #61)
1: select [145 minutes] [Created by suture.(*Supervisor).runService @ suture.go:559]
    suture      suture.go:441             (*Supervisor).Serve(#49)
    suture      suture.go:556             (*Supervisor).runService.func1(#48, 0x6, #11, #40)
1: select [145 minutes] [Created by suture.(*Supervisor).runService @ suture.go:559]
    suture      suture.go:441             (*Supervisor).Serve(#52)
    suture      suture.go:556             (*Supervisor).runService.func1(#51, 0, #13, #141)
1: select [145 minutes] [Created by suture.(*Supervisor).runService @ suture.go:559]
    suture      suture.go:441             (*Supervisor).Serve(#48)
    suture      suture.go:556             (*Supervisor).runService.func1(#45, 0x3, #8, #35)
1: IO wait [145 minutes] [Created by suture.(*Supervisor).runService @ suture.go:559]
    net         netpoll.go:157            runtime_pollWait(#16, 0x72, #104)
    net         fd_poll_runtime.go:73     (*pollDesc).Wait(#101, 0x72, 0, 0)
    net         fd_windows.go:182         (*ioSrv).ExecIO(#114, #100, 0xba5b30, 0xb, 0xcdab20, #99, 0, 0)
    net         fd_windows.go:490         (*netFD).readFrom(#99, #119, 0x10000, 0x10000, 0, 0, 0, 0, 0)
    net         udpsock_posix.go:61       (*UDPConn).ReadFromUDP(#117, #119, 0x10000, 0x10000, 0x98e4c0, 0x10000, 0, 0)
    net         udpsock_posix.go:79       (*UDPConn).ReadFrom(#117, #119, 0x10000, 0x10000, 0x10000, 0, 0, 0, 0)
    beacon      broadcast.go:201          (*broadcastReader).Serve(#90)
    suture      suture.go:556             (*Supervisor).runService.func1(#50, 0, #10, #90)
1: IO wait [27 minutes] [Created by protocol.(*rawConnection).Start @ protocol.go:191]
    net         netpoll.go:157            runtime_pollWait(#14, 0x77, #147)
    net         fd_poll_runtime.go:73     (*pollDesc).Wait(#136, 0x77, 0, 0)
    net         fd_windows.go:182         (*ioSrv).ExecIO(#115, #135, 0xb94fb0, 0x7, 0xcdab00, 0xaf7b80, 0, 0)
    net         fd_windows.go:514         (*netFD).Write(#133, #167, 0x401d, 0x8000, 0, 0, 0)
    net         net.go:184                (*conn).Write(#81, #167, 0x401d, 0x8000, 0, 0, 0)
    tls         conn.go:745               (*Conn).writeRecord(#142, 0xcdb217, #173, 0x50ac, 0x27407, 0x30000, 0, 0)
    tls         conn.go:877               (*Conn).Write(#142, #172, 0x350ac, 0x57407, 0, 0, 0)
    protocol    counting.go:45            (*countingWriter).Write(#163, #172, 0x350ac, 0x57407, 0x2, 0, 0)
    protocol    protocol.go:662           (*rawConnection).writerLoop(#69)
1: select [145 minutes] [Created by leveldb.openDB @ db.go:146]
    leveldb     db_compaction.go:768      (*DB).tCompaction(#39)
1: select [145 minutes] [Created by model.NewModel @ model.go:137]
    model       progressemitter.go:52     (*ProgressEmitter).Serve(#128)
1: select [Created by util.NewBufferPool @ buffer_pool.go:237]
    util        buffer_pool.go:206        (*BufferPool).drain(#46)
1: select [25 minutes] [Created by ignore.New @ ignore.go:53]
    ignore      ignore.go:161             (*Matcher).clean(#34, #174)
2: select [Created by discover.NewLocal @ local.go:80]
    discover    local.go:154              (*localClient).sendLocalAnnouncements(*)
1: select [145 minutes] [Created by leveldb.openDB @ db.go:148]
    leveldb     db_write.go:37            (*DB).jWriter(#39)
2: select [145 minutes] [Created by suture.(*Supervisor).ServeBackground @ suture.go:400]
    suture      suture.go:441             (*Supervisor).Serve(*)
1: chan receive [Created by go-metrics.NewMeter @ meter.go:40]
    go-metrics  meter.go:221              (*meterArbiter).tick(#3)
1: sleep [Created by main.syncthingMain @ main.go:809]
    time        time.go:59                Sleep(#31)
    main        main.go:1014              standbyMonitor()
1: runnable [Created by model.deadlockDetect.func1 @ util.go:29]
    time        time.go:59                Sleep(#2)
    model       util.go:27                deadlockDetect.func1.2(#2, #74)
1: sleep [11 minutes] [Created by model.deadlockDetect.func1 @ util.go:29]
    time        time.go:59                Sleep(#2)
    model       util.go:27                deadlockDetect.func1.2(#2, #110)
1: syscall [145 minutes] [Created by signal.init.1 @ signal_unix.go:28]
    signal      signal_unix.go:22         loop()
I’ve disabled both firewalls, comodo and windows firewall on both machines, I’ll leave it for 15 mins and do the logs again.
When you say external firewall, I have a router with a firewall built in, but these two machines are in a LAN, so I didn’t think the router would affect connection?
You don’t really want to run 2 firewalls on a windows system. At best it is a waste of resources and they can interfere with each other.
Oh, that I know, it’s like having two virus software’s installed on ya machine, it’s a bad idea, but like I said, usually 3rd party firewalls disable windows firewall.
The main part of this, since windows 10 was installed, it all broke, I had the two firewalls running when I was on Windows 8.1 with no issues. So while I sorta agree with ya, and also the troubleshooting is leading to a firewall issue, I’m seeing what the main issue, then if other users have a similar issue, then this troubleshooting may help.
Attached are the last 15 mins logs, without the firewalls on.
http://www.pjg-developments.com/synct/logs2.zip
now with all the firewalls off, if you tell me the same thing, I have a ‘theory’ but I don’t want to release it into the wild yet, as it might not be that.
So, yeah, I’ve turned my firewalls back on, and I’ve uninstalled a program that I installed about 3 weeks ago (I won’t go into details why) but I don’t need the program anymore, I was sitting here, when you were talking about firewalls, etc, and I thought where else does my data go. I have a 3rd party App installed (well, not anymore) it’s called Networx, it adds stuff into the system that can then track your data usage, anything that uses data, so you can monitor it, you put it on all the machines and it will monitor it all (https://www.softperfect.com/products/networx/) so the moment I uninstalled it on the my machines, the Synctrazor blue icon started spinning and files started transferring. So, I’m thinking there was something with that and the inclusion of Windows 10 (as it worked just fine on Windows 8.1).
At least we now know, if a user who moved onto Windows 10 has issues and the symptoms are the same, you can see if that is installed on their system. You could possibly do a build of it on a test machine with it installed, so you can replicate and incorporate something into a new build to cover this possibility.
All, I can do is say I’m sorry for causing you all hassle and trying to troubleshoot something that wasn’t being caused by your software.