Sorry, so we are talking about spinning drives or usb drives now? Is the database also on a usb drive?
the synced files are on usb spinning drives. the indexes are on SSD (c drive)
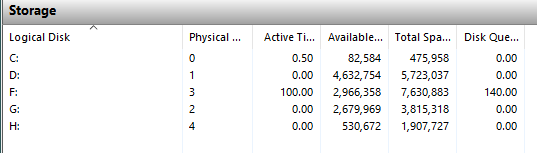
And when you say disk queue goes up, which disk are you referring to
The usb drive which contains the data. It’s locked up again this morning
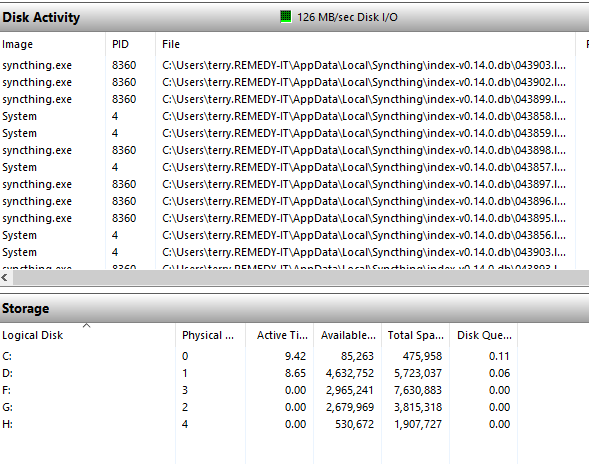
thats interesting, in the time I was making these snips this happened
ahh, rc6 has been released literally as I was typing this…
So I will see how it goes.
15 posts were split to a new topic: Panic on upgrade to 1.4.0-rc.6
Are your usb enclosures proper branded enclosures or some cheap nameless Chinese produce for a few bucks off ebay?
I’ve had cheap stuff before and it seems the usb controller panics and stops working when under load.
1 Like
Western Digital My Book 8TB
I had the same issues with cheap enclosures and gender adapters, and recently I have also encountered disconnecting problems with WD external drives when using the default Microsoft Windows 10 drivers for USB 3.0. They stopped only after I installed AMD USB drivers instead.
@terry Can you check what kind of USB chip you are using and the drivers which are currently installed for it? You can do it through the Device Manager.
Intel 8 series / C220 With MS drivers
But as mentioned before, i’ve not had an issue prior to 1.4 and I have sync data spread over 3 USB drives, but the WD does have 22 jobs and around 6Tb of data, which I do expect it to take around 2 days to index from a start/restart.
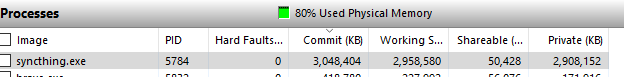
It might be tempting fate, but after 13h running, everything is ‘normal’, with the disk queue now at 12. Mem useage is 1.1Gb and the issue usually appears when I get above 2.5Gb ram.
So fingers crossed that whats changed in RC6 / 7 may have improved things. So long as there is no RC8 released today I will know by this evening how things are going.
Nothing relevant changed between any of the RCs. I honestly suspect you’re just seeing increased database activity as a result of the migration and full index exchanges after upgrade.
But the io balloons on the data volumes… Which makes no sense at all, as nothing could have changed there between 1.3.4 and 1.4.0
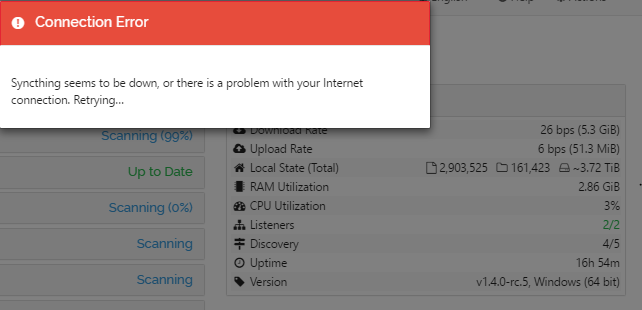
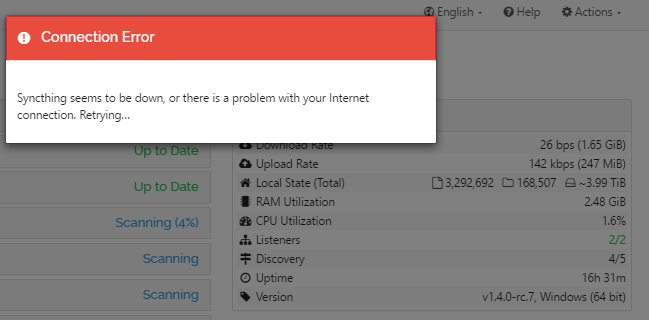
could the io be a red herring? the issue is that the web UI freezes/looses connection. even a completely broken/overloaded disk shouldn’t be able to make the api unresponsive (with the db on a separate disk).
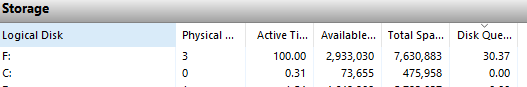
Interestingly it’s lower than normal, usually at 60 when I lose the gui
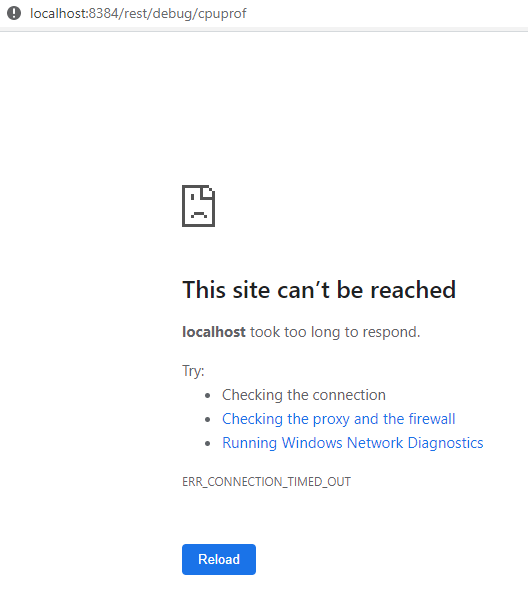
I think the io only indicates something is happening, and not necessarily the cause. For example when I try and do the cpu profile it doesn’t do anything
.
But as I have said before, this only happens when St is using a large amount of ram
However I will be leaving this alone and see if it recovers (it is working on scanning and syncing looking at the resource monitor). As yet I have not completed a full index of all the files and folders since moving to 1.4
The GUI just come back
syncthing-cpu-windows-amd64-v1.4.0-rc.7-182447.pprof (2.4 KB)
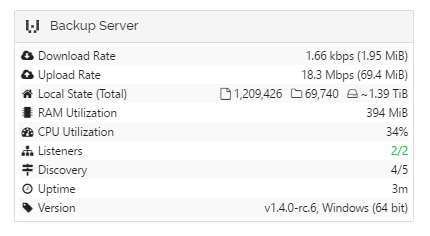
This is the state of play
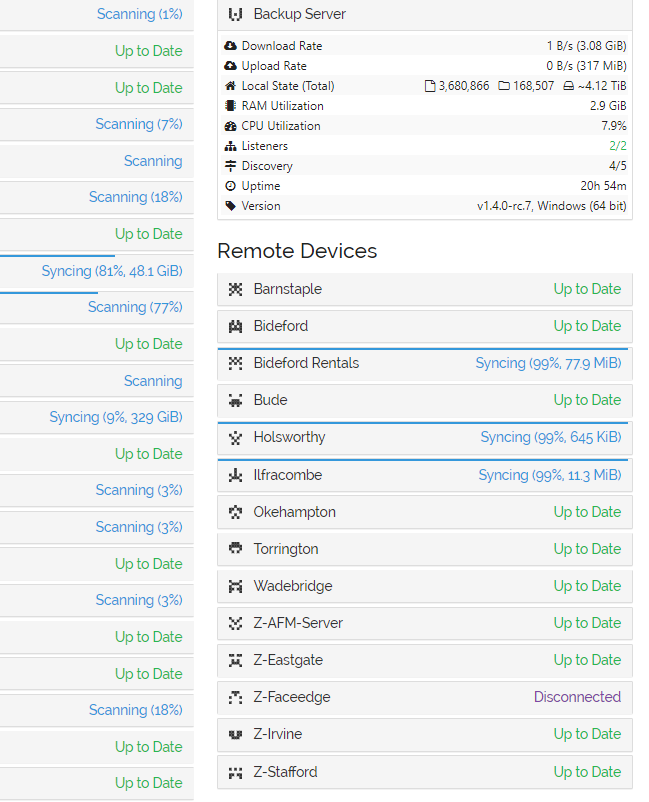
everything else is already up to date, these are mostly on the USB drive with the high io. Interesting that the snip I took a few minutes ago showed 16h 30, and this showing nearly 21h uptime
Quick update. Systems been laggy again this morning. St has been working in the background and catching up but I have noticed there’s 290 threads on syncthing (resource monitor). I’ve also found out that when I suspend the cpu process, the system becomes responsive again, so at least I don’t need to kill St in order to get work done.
High number of threads implies many outstanding io operations, pointing back at the disks.
Or lots of remote devices flooding you with requests, if you have fiddled with RawMaxCIRequestKiB, i.e. have previously set it to a negative or very high value (or the limiter is broken).
When I googled the RawMaxCIRequestKiB for more information it showed a bit of code that suggests negative numbers are disabled
func (opts OptionsConfiguration) MaxConcurrentIncomingRequestKiB() int { // Negative is disabled, which in limiter land is spelled zero if opts.RawMaxCIRequestKiB < 0 { return 0 }
so set it to 999999
![]()
You misunderstood me: I mentioned that if you did this before, that might be a reason why you see lots of activity. Do not set it to 999999, just leave it at 0 (default) if you didn’t change it before. And if you did change it before, put it back to 0 anyway.
Sorry, my bad, miss read. Set back. But no, I don’t make any changes to the stock settings unless it’s been suggested to.
1 Like