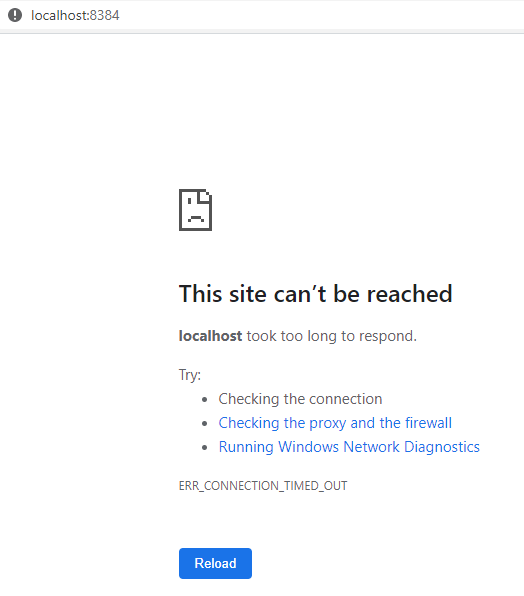
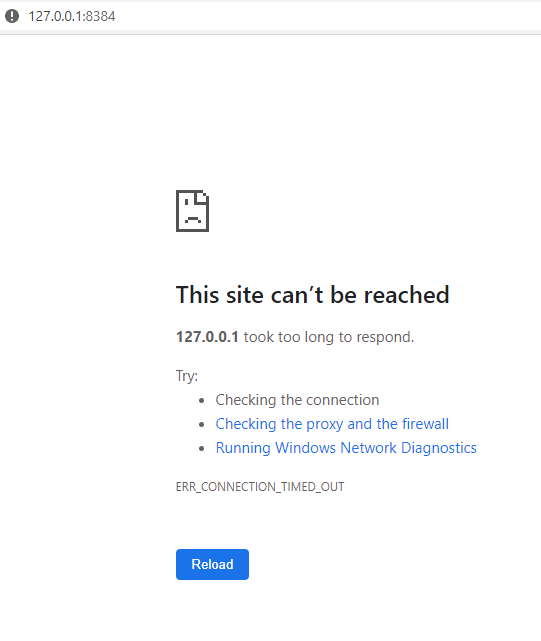
First, I declare that the data drives are USB, the indexes are on an SSD (c:\), it’s an i5 with 16Gb ram. Saying that, this version is the first where after a few hours, usually 4, I get the following under Synctrazor
I had the same issue last night and had to restart St, so I paused all but 4 jobs and this morning the gui is again unresponsive. If I refresh synctrazor or open in an external browser the page is blank.
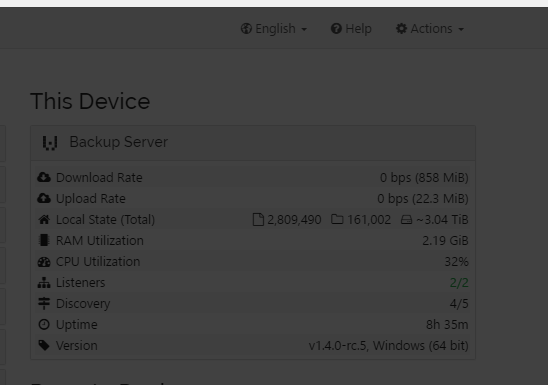
By now the local state should be in the order of several Tb (I have 7+Tb) and on previous versions, if all the jobs were left to run in tandem, I would have completed the initial scan within a day (due to USB IO)
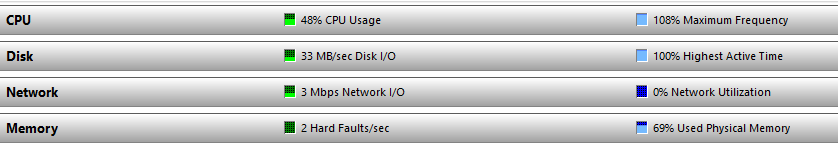
Syncthing is still running, I can see in the resource monitor is still reading and indexing. But something has changed where I feel it’s taking longer to perform tasks and the connection error this time isn’t going away with page refreshes. The system isn’t running flat out
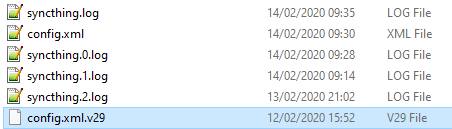
Did you have successful runs of any 1.4.0 before (i.e. none of the config and then db drop issues)? Otherwise there’s a pretty hefty db transition going on which happens before the rest api starts. I’d expect that to take quite some time with such a huge dataset. Check the Syncthing logs, if the last thing you see is something about a db transition, that’s what is happening.
It’s not the db transition (got logs privately). The log indicates it’s up and running and listening at the usual place (127.0.0.1:8384). What happens if you try to access that in a web browser?
This is not only a v1.4.0 issue. From time to time I head also in the current or in one of the past versions, especially if I use a GUI over the internet, but sometimes I had also in the lokal network.
I have had this in the past, usually just after starting up. The difference this time is that it’s not going away on refreshing the browser or opening in a different browser.
It’s as if St isn’t updating after a period of time.
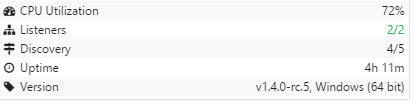
I have gone to rc5, so I will see what happens later. I mentioned it before seeing a new release
There’s only one log (potentially split in multiple files) that’s relevant. For the question here the one you sent me (the newest) had the info. And as I wrote, it wasn’t hanging on a db transition, so that’s not the issue here (aka my hypothesis has been refuted).
So what you are seeing is likely just that Syncthing is so overloaded that it can’t respond to the UI queries (which isn’t nice). You could get a cpu profile (Profiling — Syncthing documentation) to see whether anything weird is going on.
Coming back to your initial post:
The one thing that changed was reducing the folder concurrency by default to the amount of cpu cores. Did you ever set the MaxConcurrentScans setting before? If you didn’t that was a change in performance for you. Is your data on spinning disk and how many separate usbs? If it’s SSDs and/or lots of parallel drives restricting the parallelisation might be bad for you indeed (however I kind of doubt that’s the case ).
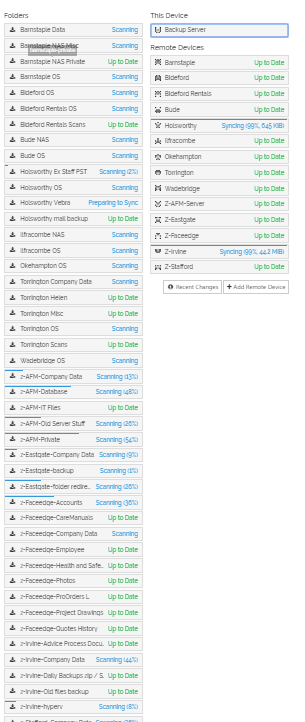
I had a try with various settings on the concurrency. At the moment it’s -1, however I had tried it on 0, 5, 10, 20 (I have 45 sync folders). Last night I paused all but 4 and left them alone over night (on -1 setting). This morning the resource monitor was showing that USB drive at 100% (always is), but the disk queue at 60 or so. As the moment I have all the folders syncing, no pauses and the disk queue is 16.47.
It feels that after a while (at least on rc4) something gets backlogged and the disk queue increases.
I think it was on rc3, the computer went into a terrible lock up situation, even the ssd was 100%, very very unresponsive, but thats only happened the once.
I will see how rc5 goes and if it reproduces the problem I will post an update.
Receive only folders are on 3 separate USB 3 drives (on their own ports). SSD in the OS drive and is where the indexes are.
Most of the sync jobs had not been updated in 4 days
After a few hours the GUI is inaccessible (see above posts)
Disk queue get ever higher when there is at least 3 scans running. Concurancy the cause?
When doing a global pause, St is still working in the background, I had it paused for over an hour and there was still disk activity
CPU time I feel is far higher than on previous releases
Syncing throughput is slower from remote PCs
and today I noticed the download rate was all over the place, sometimes 0, sometimes the 8 on it’s side and Tib, sometimes briefly showing the actual speed
W10 pro. On all the remote sites they are not having any issues. I think it’s because I have lots of jobs, lots of data and slow io due to there being 3 usb drives.
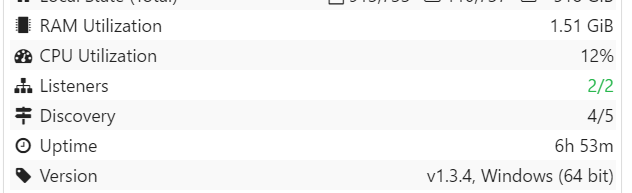
But yes, 1.3.4 is day and night in comparison. CPU load
(was over 50%), usb disk queue is
and I have all jobs scanning or are already up to date
Here you clearly don’t have any folder concurrency limit, and 1.4.0 does have a default concurrency limit (number of cpu cores). Did you try with concurrency unlimited on 1.4.0?
I tried different values, -1, 0 1,2,3,4,5 10, 20. When I did 1, the system didn’t lock up, however it did hit a 384Gb download and essentially stopped anything else from syncing, so went to 2, but hit a 30Gb file, so again, stopped any progress, then went to 3. After a few more hours the disk queue rose back up to 60ish, thats when I paused all the folders and waited for the queue to drop and expected St to stop, but it didn’t.
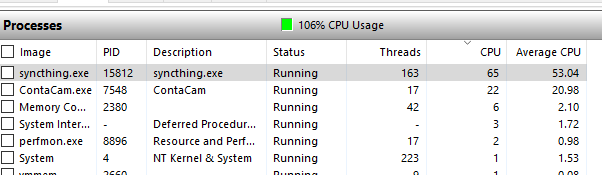
What I noticed and took screen dumps is the concurrency settings work fine to start with, but after a period of time where there is multiple scans everything starts to grind away, cpu usage goes up to where im running at 106% cpu time, access time goes up.
I thought I would give 1.4 another try, so let the db upgrade, set concurrency to 4 and left it alone. PC now become sluggish with St running a high cpu again
yet under 1.3.4 all jobs were scanning and was low cpu loading.
It would be good if you could show a history of the workload. Also it would be good to get the system load in comparison, since it always deviates slightly. In addition, to have what kind of system, with which performance, which CPU, how much RAM, etc. Then on the Syncthing side, what quantities are managed.
I have found that there are peak loads on my servers with syncthing, some of which reach over 50%, on average I have estimated 25%, at times it drops to 0%. So I think a record to show a curve might be good.
On my side all the Poweruser settings are on default.