Performance issues under 1.4.0 rc4

It would be good if you could show a history of the workload. Also it would be good to get the system load in comparison, since it always deviates slightly. In addition, to have what kind of system, with which performance, which CPU, how much RAM, etc. Then on the Syncthing side, what quantities are managed.

I have found that there are peak loads on my servers with syncthing, some of which reach over 50%, on average I have estimated 25%, at times it drops to 0%. So I think a record to show a curve might be good.

On my side all the Poweruser settings are on default.

im all locked up again

image

so this time i’m leaving it alone. All the jobs resync and watchers are disabled so in theory the only disk access for the time being is the hashing.

CPU is keeping the room warm again

image

Why though, did you reset the database? If it needs to rehash everything on upgrade something is wrong, that shouldn’t happen. I didn’t see any indication of that happening in the log you sent me previously either.

Can you please take and share a cpu profile: https://docs.syncthing.net/users/profiling.html

When I downgraded to 1.3.4 it wouldn’t talk to the upgraded indexes so I renamed the folder and let it reindex. Maybe i’m using the word hashing out of context. I mean scanning / indexing.

After a day or so I had almost all the jobs reindexed and took it all back to 1.4. The upgrade took around 20 minutes. It started at concurrency 4, but the indexing was far too slow with some jobs reporting 4 days to scan (with barely any disk access), so I set it to -1 and got all the jobs scanning, but this results in St getting overloaded.

I’ve killed the current sync to enable debugging and here is the profile. Do you want one when it’s all locked up or at random times?

syncthing-cpu-windows-amd64-v1.4.0-rc.5-095450.pprof (120.1 KB)

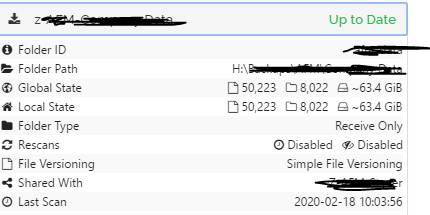
Another thing i’ve started to see, and don’t know if this is related or is a bug in itself, is the jobs say that are up to date, yet the local state differs to the global state. If I try a rescan on that job it comes straight back to being up to date.

it’s not all the jobs,

image

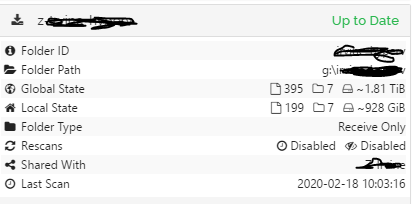
and not related to large jobs…

image

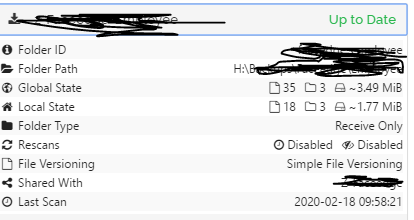
it’s just some folders, the majority are correct…

image

Thanks for the cpu profile: Almost literally all accounted cpu time is spent generating folder summaries. Cpu usage should go down drastically if you close the web UI/Synctrayzor. I will file a PR shortly addressing this problem. As to why it seems worse than with 1.3.4 I have no idea.

I can’t say for sure, but the local vs global state discrepancy looks like a different issue. I’ll open a separate topic.

A post was split to a new topic: Global state doesn’t match local state on up to date folder

This is now revolved, see Global state doesn't match local state on up to date folder

Not out of the woods. PC was dead in the water this morning, low CPU %, St on 3Gb ram, disk queue back in 60-70. No matter what I clicked on to open it, nothing happened, even outlook wasn’t syncing emails. Wasn’t able to get a cpu profile. After an hour trying I killed St and literally everything loaded onto the screen that I had clicked on.

Syncthing was running, I would see in the resource monitor / disk that files were being indexed. But why would the computer be so unresponsive after a period of time?

Concurrency was set to -1 as I still have not completed a full scan of the folders since 1.4 came out.

@terry Did Syncthing use a lot of swap memory :thinking:? Virtual memory makes pc’s very slow especially on Windows where we have to deal with gui responsiveness.

To be honest, I think you should stop pointing fingers at syncthing and start pointing fingers at your drive.

Sure, syncthing performs disk operations, but the fact that the rest of your PC locks up is usually a sign of a slow drive with high seek times. OS is usually smart enough to schedule IO reasonably between different processes, but it seems the drive is so slow that no sensible scheduling is possible.

Suggest you run io benchmarks on your drive and see if you are seeing sensible numbers, as I suspect you won’t be.

Where do you store the database - spinning disk or SSD?
The timing makes me suspect the blocks GC as a culprit. On the other hand I don’t see why it would lock up your system. I checked the expected memory usage for your 1.5 million files with https://godoc.org/github.com/willf/bloom#EstimateParameters and got less than 2MB as a result.
If you do the following, be prepared to kill Syncthing - it will deliberately run blocks GC continuously to check if this is the problem: Can you run Syncthing with environment variable STGCBLOCKSEVERY=1s and see whether it you get the same symptoms more or less immediately.

Thing is the issue is present on 1.4.0 only, 1.3.4 works fine.

I am still sceptical.

I think it’s just a dying drive that happens to be more exposed/visible because we do wider scans every now and then. There is nothing fundamentally wrong it what we do, if there was there would be more people talking about it.

Again, run IO benchmarks, see if the numbers line up with what the vendor advertises.

I’ve been out all day. To catch up, I have 16Gb ram, there is a small amount of swapping, but the OS, database and swapfile are on an SSD

I declared that the data drives are USB, but as mentioned I have never had St lock up this bad before. I know the io is poor, but that would in no way stop the PC from functioning.

i’m currently running concurrency at 10, and disk queue is 11. I have had it at -1 and with everything scanning would plod along at around 16 for several hours then something happens and the queue goes to 60.

The drive is not a year old, it’s WD 8Tb in a powered enclosure, so 3.5", there’s nothing to indicate any issues. It’s also USB3. Disk read io is

image

I will kill St, set concurrency to -1 and set the STG and see how it goes

STGCBLOCKSEVERY hasn’t made any difference, it’s not made it lag or queue go up. I will kill, remove the setting and try again and see if I can record the resource monitor somehow to see what happens

2.avi (11.5 MB)

Here’s an edited review of last nights sync. Key events (im using the time on the original video, not the time on the file).

9:04:38 Syncthings uptime jumps from 6h 8m to 14h 35m

I scroll the video towards the end but watch the disk que

9:21:27 The disk que comes from high to ‘normal’

9:22:16 Indexes are being read / written, disk que goes up

9:23:52 Indexes activity increases, Disk IO ramps up to 101MB/sec (top of resource monitor) que increasing

9:24:13 Synctrazor gui no longer responding

9:25:00 Its just indexing

At this point im trying to run a cpu profile, but the system is starting to go slow so I save the video.

I have reapplied the STGCBLOCKSEVERY variable and will see if that helps. It seems that when it indexes in chunks is where it struggles, but only after a period of time ( memory related, high mem - index issue?). If the variable is updating the index more often, then in theory I should not get locked up.

Please don’t!
As I wrote before, that was only an experiment to forcefully trigger GC to check if that immediately locks freezes Syncthing. Running GC continuously is not helping/mitigating/doing anything good.

Please share the logs from that time and ideally include the folder side into screenshots/-casts (starting around 22.16 the download rate becomes really high, so I’d expect folders are syncing the two files added to local state).

Stopped and removed.

Can you advise what logs you need

I should use “the log” not “logs”. Unless otherwise stated, the required log is always syncthings own log. If they get archived after some time (they are on Windows i think) then the file with entries from the time in question. If unclear which, just take all.