I’ve got a nice fat panic.log file. Anyone want to take a look at it?
Took me a century to figure this out but:
1: syscall [5 minutes] [locked] [Created by model.(*sendReceiveFolder).pullerIteration @ rwfolder.go:347]
    syscall     syscall_windows.go:174    Syscall6(#2207, 0x5, 0xb54, #2169, 0x20000, #2073, #2074, 0, 0x42cd70, #1646, ...)
    syscall     zsyscall_windows.go:327   WriteFile(Handle(0xb54), []byte(0x20000 len=131072 cap=825852976084), *uint32(#2074), *Overlapped(0x5b4e65), #1143)
    poll        fd_windows.go:703         (*FD).Pwrite(*FD(#2063), []byte(#2169 len=131072 cap=131072), #877, 0x0, 0x0, 0x0)
    os          file_windows.go:232       (*File).pwrite(*File(#1728), []byte(#2169 len=131072 cap=131072), 997588992, 0x0, #2075, 0x42cd70)
    os          file.go:170               (*File).WriteAt(*File(#1728), []byte(#2169 len=131072 cap=131072), 997588992, 0x0, 0x0, 0x0)
    model       sharedpullerstate.go:75   lockedWriterAt.WriteAt(#1211, #284, #1962, #2169, 0x20000, 0x20000, #877, 0, 0, 0)
    model       <autogenerated>:1         (*lockedWriterAt).WriteAt(#1898, #2169, 0x20000, 0x20000, #877, #2093, 0x20, 0x20)
    model       rwfolder.go:1358          (*sendReceiveFolder).pullerRoutine(#1020, #1937, #1939)
    model       rwfolder.go:349           (*sendReceiveFolder).pullerIteration.func3(#1020, #1937, #1939, #27, #1871)
Your drive is most likely screwed, as a single write to disk is taking more than 5 minutes.
Hmmm.
At first glance it looks ok:
C:\WINDOWS\system32>chkdsk D: /F The type of the file system is NTFS.
Chkdsk cannot run because the volume is in use by another process. Chkdsk may run if this volume is dismounted first. ALL OPENED HANDLES TO THIS VOLUME WOULD THEN BE INVALID. Would you like to force a dismount on this volume? (Y/N) y Volume dismounted. All opened handles to this volume are now invalid. Volume label is Data.
Stage 1: Examining basic file system structure … 33024 file records processed. File verification completed. 30 large file records processed. 0 bad file records processed.
Stage 2: Examining file name linkage … 38058 index entries processed. Index verification completed. 0 unindexed files scanned. 0 unindexed files recovered to lost and found.
Stage 3: Examining security descriptors … Security descriptor verification completed. 2517 data files processed.
Windows has scanned the file system and found no problems. No further action is required.
976629759 KB total disk space. 428825592 KB in 29753 files. 15156 KB in 2519 indexes. 0 KB in bad sectors. 128819 KB in use by the system. 65536 KB occupied by the log file. 547660192 KB available on disk.
4096 bytes in each allocation unit.
244157439 total allocation units on disk. 136915048 allocation units available on disk.
C:\WINDOWS\system32>
I’m just looking at the full log starting at 17:02 leading up to that panic
Just after syncthing starts I see [CIZST] 2017/12/18 17:03:23.947377 sync.go:150: DEBUG: RWMutex took 2.4882937s to lock. Locked at model\sharedpullerstate.go:73. RUnlockers while locking:
some minutes later
[CIZST] 2017/12/18 17:04:38.622992 sync.go:150: DEBUG: RWMutex took 18.1144117s to lock. Locked at model\sharedpullerstate.go:254. RUnlockers while locking:
then
[CIZST] 2017/12/18 17:06:09.892250 sync.go:150: DEBUG: RWMutex took 2m47.0832974s to lock. Locked at model\sharedpullerstate.go:73. RUnlockers while locking:
then
[CIZST] 2017/12/18 17:08:09.632626 sync.go:150: DEBUG: RWMutex took 4m17.1829952s to lock. Locked at model\sharedpullerstate.go:73. RUnlockers while locking:
and finally
[CIZST] 2017/12/18 17:08:55.361788 sync.go:150: DEBUG: RWMutex took 4m54.9211192s to lock. Locked at model\sharedpullerstate.go:73. RUnlockers while locking:
panic: deadlock detected at fmut 2017/12/18 17:09:03.166660 debug.go:39: DEBUG: Enabling lock logging at 100ms threshold
If I’m reading this right it’s individual locks taking longer and longer to be acquired… could that not point to some kind of resource leak?
I am not saying something is wrong with the filesystem, I am saying something is wrong with the drive.
That lock in sharedpullerstate.go is a lock that is acquired on every write operation to a file. What is happening is that every write is taking longer and longer, up to the point where a write takes over 5 minutes at which point it triggers the deadlock detector.
I cannot see any resource leak, unless you can point me to it. I do however see slow disk writes.
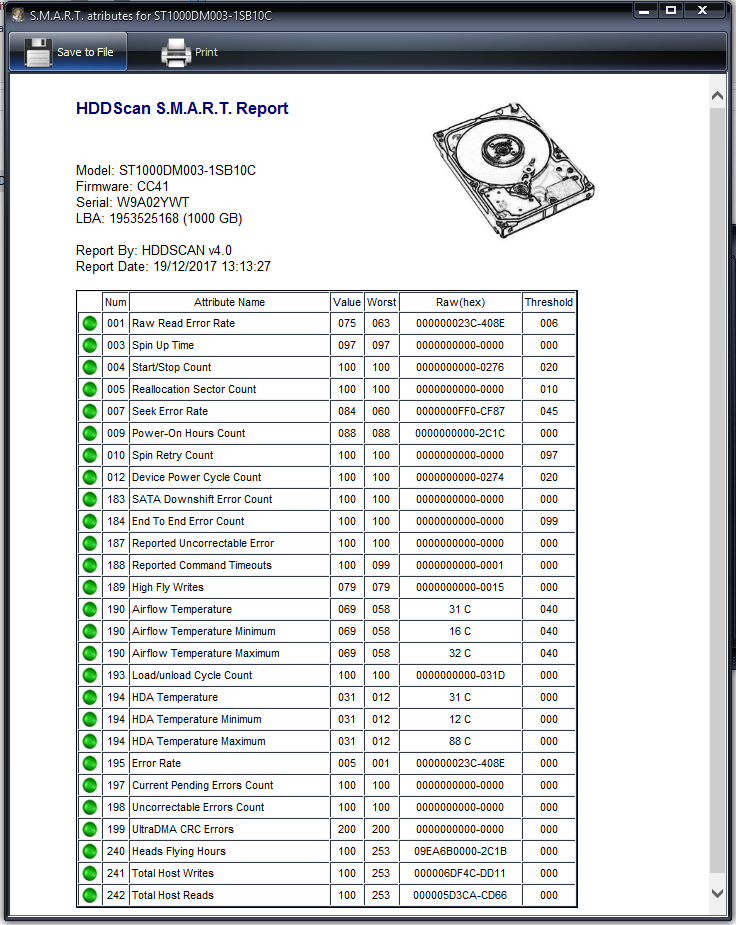
@Ben_Curthoys, check the SMART status of your drive with a tool like
https://crystalmark.info/software/CrystalDiskInfo/index-e.html and also use tools to test you drive mechanics, functionality and disk surface
This topic was automatically closed 30 days after the last reply. New replies are no longer allowed.