That explains the size. We’re currently storing the relative path per file. For a usage scenario like yours this ends up with a lot of bloat in the files table.
The question is if it would speed things up or would end up being worse if we reduce the size by e.g pulling the path prefixes into a separate table.
Hopefully calmhs patch can help with the other big chuck of the database: blocks
But ultimately I think our scaling problem might be also cache related. We switched back to the default page cache size in v2.0.7. It was a good decision to get the memory usage of our read connections under control, but I fear that our writer connections suffer in cases like this.
My setup is ~30 folders, ~5 peers, ~1M files, ~400GB now.
I was trying setup with different a) MaxConnections, b) Cache (per connection, that’s why a), c) IdleTime to speedup DB close to prune cache earlier, when not needed.
My current findings are:
safe min MaxConnections seems to be like around 6. That’s for my setup with scale given above. With 2, 3, 4, it deadlocks sometimes. With 6 never seen as of now. But not sure. Maybe 8 is a better shot here.
cacheSize I can live with, given this setup, is 32MB per connection. It mostly trades memory for CPU/latency to go to OS page cache however. Can speed up things, but not a game changer. But if you see CPU all saturated, increasing may be helpful, but not my case.
MaxIdleTime 10 seconds runs fine and you can have A LOT larger cache with this, but is causing this bug more often than without (like per default): Consider better reaction to SQLITE_BUSY · Issue #10529 · syncthing/syncthing · GitHub - just because auto-closing DBs is doing WAL commits automatically and thus more often. If this gets fixed by just retrying, this can save on better cache management.
(stats based on aproximatly 3 month of tests on all my live systems)
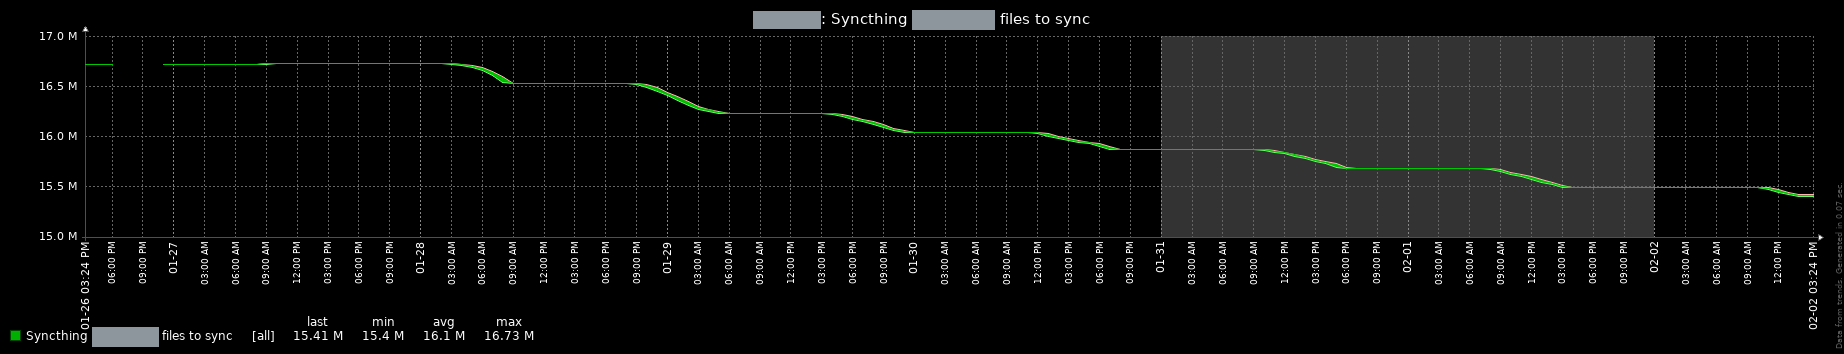
More information in case it can be helpful to pinpoint a bottleneck. You’ll find the “needFiles“ value history over the last 7 days as reported by the API to our Zabbix server. Syncthing was restarted 6 days and 21 hours before the generated image (the gap in the graph is due to the API not being available for some time after the restart).
For each of the 7 decrease periods in the needFiles value on this graph I can find an initial sharp load increase that doesn’t last long (less than an hour which is the data’s history resolution). There are both sharp increases of IO wait and actual CPU work at these times but the history data isn’t precise enough to make sure that they overlap or don’t.
That said I don’t think they happen at the same time given how the system behaved when I looked at it though htop (and I look quite often…).
Another food for thought : the 2 other devices syncing this folder (the send-only and the other receive-only) both report that the v2.0.10 device is currently “Syncing (48%, 9.54TiB)”.
9.54TiB is the sum of the out of Sync Items of the two folders : 7.79TiB for this folder and 1.74TiB for the other one.
(The other one is currently “Waiting to Sync” as only one folder can do IO intensive work at a time.)
It seems most of the work done is resolving out of sync items that shouldn’t exist as the 3 devices report the same Global State for the folder (sometimes the v2.0.10 device lags a bit but always catch up). So the v2.0.10 device should already know that almost all of the files are already synced having finished a full scan of the folder. I’m not sure what needs to be processed.
There’s not much network activity either. Since the restart almost 7 days ago the total download is 2.15GiB and the total upload is 1.69GiB.
Can you decrease the scrape interval to something like a minute for a few weeks to collect more granular data? (Perhaps just the syncthing and cpu/disk usage data)
Actually there is more granular history data than I thought. It seems Zabbix chooses to switch to trends data when rendering the graphs if history data is too fine-grained for the period. If I zoom on shorter 2-days periods I get the history data points (for Zabbix related values every 5 minutes).
The IO wait spikes happens at the very start of the decreases of needFiles, sometimes even before the graph for needFiles shows a decrease it reaches 45% which is about 5 processes waiting for IO. The iowait decreases after about 30 minutes but remains around ~10% which means that although there is work done there’s the equivalent of about one process waiting for IO during the whole period during which needFiles decreases.
I changed the period to collect more fine-grained data about Syncthing (every 1mn instead of 5mn) but I don’t think it will help much now that I can see that the IO wait spikes last about 30 minutes.
One possibility of these “doing something” / “doing nothing” cycles is internal maintenance which is each 8 hours by default. It seems that timespans of “doing something” are almost exactly these 8 hours, and then after, they are interrupted by “doing nothing” - this is the time when maintenance is effective.
Maybe it is not this case and I am interpreting this wrong, but consider it - this was my case at least. Message on the solution is above - disable it or at lease make it less frequent.
UPD: 2.0.14 released where tuning it is available without hacks.
2026-02-03 17:23:28 INF GC was interrupted due to exceeding time limit (processed=6 runtime=5m19.649458056s folder=xxxxx-xxxxx fdb=folder.0002-qioaq2fp.db table=blocklists rows=28498961 chunks=284 log.pkg=db/sqlite)
This is on the affected folder and happens regularly with groups of two messages separated by approximately 3 hours happening at roughly 1-day intervals :
2026-01-31 21:09:32 INF GC was interrupted due to exceeding time limit (processed=7 runtime=5m32.485188706s folder=xxxxx-xxxxx fdb=folder.0002-qioaq2fp.db table=blocklists rows=28480312 chunks=284 log.pkg=db/sqlite)
2026-02-01 00:33:44 INF GC was interrupted due to exceeding time limit (processed=1 runtime=11m32.559689506s folder=xxxxx-xxxxx fdb=folder.0002-qioaq2fp.db table=blocks rows=126605643 chunks=1266 log.pkg=db/sqlite)
2026-02-01 18:20:38 INF GC was interrupted due to exceeding time limit (processed=7 runtime=5m43.474690066s folder=xxxxx-xxxxx fdb=folder.0002-qioaq2fp.db table=blocklists rows=28481232 chunks=284 log.pkg=db/sqlite)
2026-02-01 21:25:07 INF GC was interrupted due to exceeding time limit (processed=1 runtime=11m4.686691217s folder=xxxxx-xxxxx fdb=folder.0002-qioaq2fp.db table=blocks rows=126605643 chunks=1266 log.pkg=db/sqlite)
2026-02-02 20:19:18 INF GC was interrupted due to exceeding time limit (processed=6 runtime=5m31.391500503s folder=xxxxx-xxxxx fdb=folder.0002-qioaq2fp.db table=blocklists rows=28483607 chunks=284 log.pkg=db/sqlite)
2026-02-02 23:13:50 INF GC was interrupted due to exceeding time limit (processed=1 runtime=10m46.316504909s folder=xxxxx-xxxxx fdb=folder.0002-qioaq2fp.db table=blocks rows=126605643 chunks=1266 log.pkg=db/sqlite)
Would it be worth it to add support for postgresql and outsource the database trouble to a more qualified secondary process? Seems like that should be relatively straightforward if you wanted to go fish that path.
Adding postgres support would solve a lot of headaches as it scales better at a certain point.
That said, I still think that the GC handling is a low hanging fruit that can be optimized. Will that magically solve the performance problems in this case? Maybe not, but we would push the boundaries of a working sqlite setup a bit further.
Bumping the cache size of our writer connection is the other low hanging fruit IMHO. We could do that on the fly using PRAGMA cache_size. Raise the cache size after acquiring the connection and lower it back to default when we release it.
Possible but a bit convoluted : the user zabbix doesn’t have read access to the individual files currently (I’d have to make a specific configuration to get the file size using sudo).
That said the .config/syncthing has its own dedicated filesystem and not much changes currently except the WAL size corresponding to the folder in the “Preparing to Sync” state. So I can have an estimation of the evolution of the WAL size by looking at the filesystem used space which was easy to add today.