Dear friends,
Recently, I have been encountering intermittent “Connection Error” messages.
Linux Mint 22.2 Syncthing v2.0.11, Linux (64-bit Intel/AMD) syncthing_log (574 Bytes)
Dear friends,
Recently, I have been encountering intermittent “Connection Error” messages.
Linux Mint 22.2 Syncthing v2.0.11, Linux (64-bit Intel/AMD) syncthing_log (574 Bytes)
The warning message in the log you provided can generally be ignored.
Do note that the v2 WARNING log level is less severe than the v1 WARNING log level.
From the 2.0 release notes:
Problem solved. While connected to ProtonVPN all of a sudden, I am losing packets and this acts like a disconnection.
Great! I still don’t think the errors you cherrypicked from the log were the cause of your devices not connecting though.
100.85.0.1 is the default gateway and destination address on the proton-vpn-network-manager killswitch interface, so it is expected that you get that error if you have the killswitch enabled.
I think ProtonVPN caused both caused the error messages (expected, unless you’re running a NAT-PMP server on localhost), and caused your devices to not connect (unexpected).
Source:
Thanks @marbens. The devices still connect/sync just fine; however, it was the intermittent “Connection Error” that was bugging me every minute and then it disappeared. I am using a router with OpenWRT installed. What do you recommend that I do, exactly?
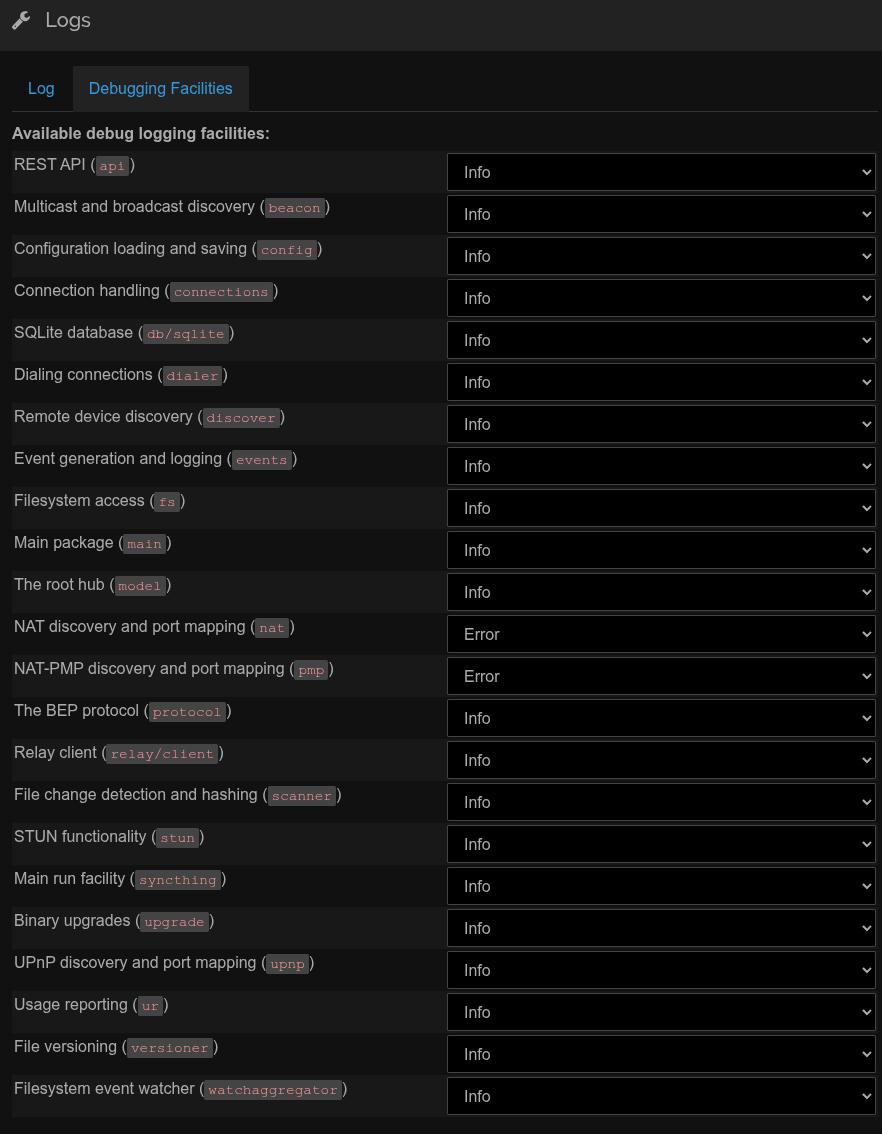
If ignoring the warning is hard for some reason, you can try reducing the log level of the nat package to ERROR (e.g. by setting the STTRACE environment variable to nat:ERROR).
Thanks @marbens . The log warnings aren’t the concern, it is seeing the error show up on the GUI and refreshing the dashboard after every “connection error” warning.
I just stopped the VPN and I am still receiving the “Connection Error” warning. I am not sure what is going on, now.
Yes, that is correct.
What URL are you using to access the GUI?
— 1.1.1.1 ping statistics — 300 packets transmitted, 300 received, 0% packet loss, time 299363ms rtt min/avg/max/mdev = 26.845/42.567/166.382/18.898 ms
— 127.0.0.1 ping statistics — 300 packets transmitted, 300 received, 0% packet loss, time 306109ms rtt min/avg/max/mdev = 0.021/0.067/0.224/0.012 ms
Is there a way, in the app, to capture why this is happening?
Check browser console for network or JavaScript errors, see what it says.
Yes. I’m pretty sure he’s talking about the JavaScript console you can open with Ctrl+Shift+J on Chromium-based browsers, and Ctrl+Shift+K on Firefox-based browsers.
Thanks, the error comes up here.

127.0.0.1-1763822323197.log (4.2 KB)
Further to this, it seems to only happen with my normal Brave profile. It does not happen with a Brave private window nor Firefox.
Sigh, now it is definitely happening with a Brave private window but not on Firefox.
This topic was automatically closed 30 days after the last reply. New replies are no longer allowed.