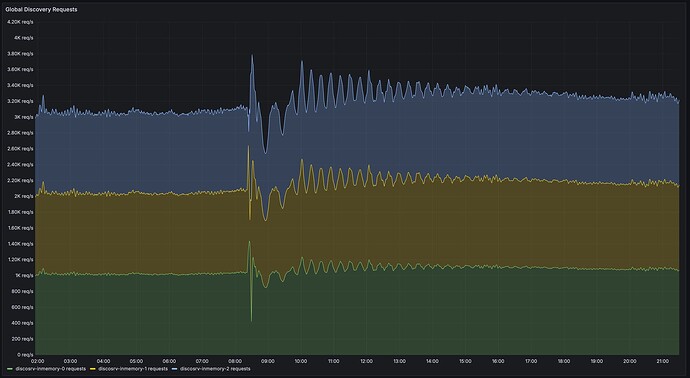
I’ve been doing some work on our infrastructure.
Our web services were mostly designed about a decade ago when containers where a newfangled thing and we had a handful of clients to serve, running on some lovingly handcrafted VMs at DigitalOcean. Some of those things have scaled more gracefully than others… I’ve shifted slightly how we deploy and run stuff in the meantime, and most recently moved our hosting from DigitalOcean to Scaleway, where we currently run almost all our services in a Kubernetes cluster.
DigitalOcean served us well for quite some time, but unfortunately less so after moving much of our infra into containers in Kubernetes. Their network load balancer had a never ending stream of issues with our number of active connections (even without moving discovery to it), plus didn’t support IPv6 and had no plan to do so in the foreseeable future. Scaleway has reasonable pricing, and their load balancers support IPv6 so we could actually move discovery into the cluster.
(Aside about pricing: our biggest constraint in choosing a cloud operator, price wise, is our outgoing bandwidth. Virtual machines cost more or less the same everywhere (within an order of magnitude) but outgoing bandwidth varies quite a lot. We serve about 15 TB of data each month, most of it discovery and relay pool responses. On all the big clouds this would give us an egress bill of well over 1000 euros per month. Several of the smaller operators have a much more generous allowance where it’s essentially free with the VMs, DigitalOcean and Scaleway being among those.)
Anyway, discovery. The discovery service is our main resource driver.
We get about 3k-4k requests per second in a steady state. You might think a few thousand HTTP requests per second isn’t that much and could in principle be handled on a fancy Raspberry Pi, and you’d probably be right, but our clients are special… “Normal” web requests are browsers, they open one HTTPS connection and send a hundred requests over it. We only ever get one request per connection, so every request is a TLS handshake, with a somewhat unusual certificate type at that, and (for announces) we must verify the client certificate. This uses a surprising amount of CPU: we currently average about six CPU cores (of some beefy Xeon variant) all the time just for TLS termination. (Compressing responses would make this significantly worse too, so I’ve turned that off for now.)
It’s also an odd workload because it’s very inelastic, and so becomes very latency sensitive. Again, many “normal” web services react to some form of backpressure when things are slower than usual – requests that depend on each other, like you don’t load the images on a page before actually getting the HTML that refers to them, etc. Discovery isn’t like that at all since each request is a singleton from a separate client. We get minimum 3000 new connections every second whether we had time to process the ones that came in last second or not. If we only returned an answer to 1000 of them we now have 5000 open connections that need handling. Handle 1000 of those and we have 8000 connections awaiting response next second, and so on.
This becomes very fragile to any kind of pause in processing: leveldb compaction and even GC pauses would lead to short stalls that quickly overwhelmed our Traefik proxies or load balancers where connections queued up. Recovering from this wasn’t always trivial since we essentially end up in a DoS situation with clients retrying timed out requests.
(System effect aside: another effect of client retries, like re-discoveries when a device is just not found, is the ringing-like-a-bell curve for any minor outage. We smooth this over time by returning a random-fuzzed Retry-After header for Not Found responses, but any blip in responses is still visible for hours.)
I’ve put a fair amount of engineering work into improving the discover server for this. I experimented with database settings, switching the database from leveldb to Pebble (made things worse), and finally settled on using an in-memory map – this was the only thing with consistent enough latency… Even then there was a fair amount of tuning and profiling required to get allocations low enough – and CPU bound goroutines short enough – that GC pauses didn’t kill us. The database is periodically flushed to permanent storage and read from there on startup.
There are three instances of the discovery server binary, all of which have the full set of data to be able to answer requests. Announcements are replicated between them using a message queue.
The Traefik proxies are assigned the bulk of resources on each cluster node and are configured to 429 requests when they queue up towards the discovery server (which they don’t, currently ;).
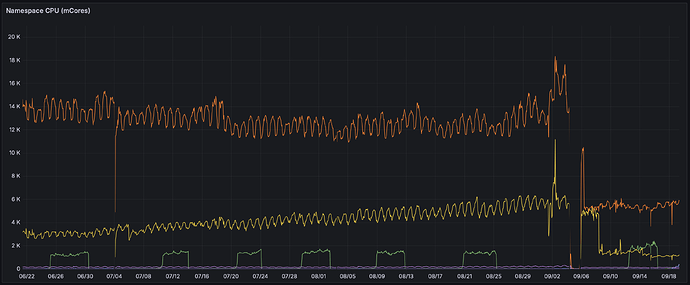
This has been stable for a little while now, enough that I’m confident it’ll work for us. Total resource usage is about 8 CPU cores and 6 GiB of RAM, but RAM usage spikes when connections spike for whatever reason. This is down from about 26 CPU cores at its worst prior to the latest rewrites; orange line here is Traefik CPU, yellow is discosrv. (The metrics gap around the beginning of the month is me migrating things back and forth…)
My code changes for these things generally happen on the infrastructure branch, and I merge them after stabilisation and cleanup. I haven’t asked for review on them, for all the practical reasons you might assume, but they’re up there for anyone who wants to take a look. There’s another fairly large change coming which I’ll write up shortly, and which I will put through review. ![]()

