One of the infrastructure services we provide is the usage reporting. Opted-in Syncthing instances send usage reports with some metrics and feature counts. The server accepts these, aggregates, and draws a few graphs and tables on https://data.syncthing.net/.
The way this works currently is that reports are stored in a PostgreSQL table, there is a periodic aggregation run that creates a couple of other tables for the historical graphs (the queries would take too long otherwise), and then there is some server side code to query the current reports and massage them into metrics and render the report page. There a couple of downsides with this. Primarily, storing all reports in PostgreSQL is wasteful and takes up an ever-growing amount of disk space and database resources. There’s no reasonable reason we’d need direct access to an individual report from 2019.[1] Additionally, while having a bunch of code to generate metrics does give us precisely what we want to see, it’s also a bit inflexible and cumbersome to change if we want to add new graphs or slice the data in some new dimension.
I’ve revamped this and have a suggested new approach. The code is written and running, but not reviewed / merged and the approach can be discussed. Here’s how the new thing works:
- The server accepts the reports and keeps the last 24 hours of them (the latest one per unique ID) readily accessible (in memory).
- The reports are archived daily to blob storage. (Thus we can reprocess them into a different system or by a different method if we find that the current approach was wrong.)
- The same server provides a Prometheus/OpenTelemetry-standard metrics endpoint, which provides the summary metrics for the current set of reports.
- Our existing Prometheus/Grafana setup scrapes this endpoint and gathers the metrics.
- The metrics can be presented in regular Grafana dashboard.
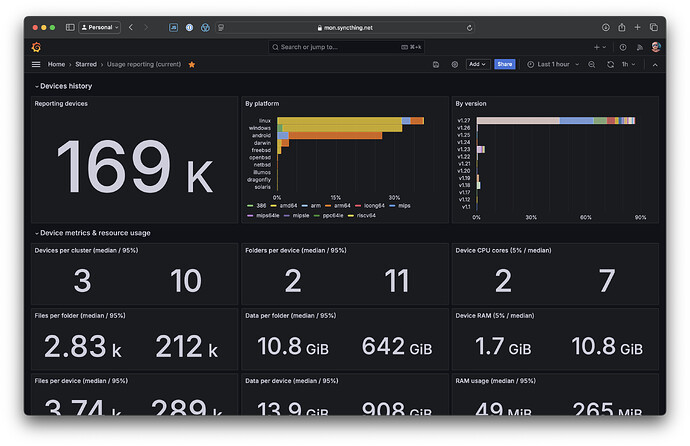
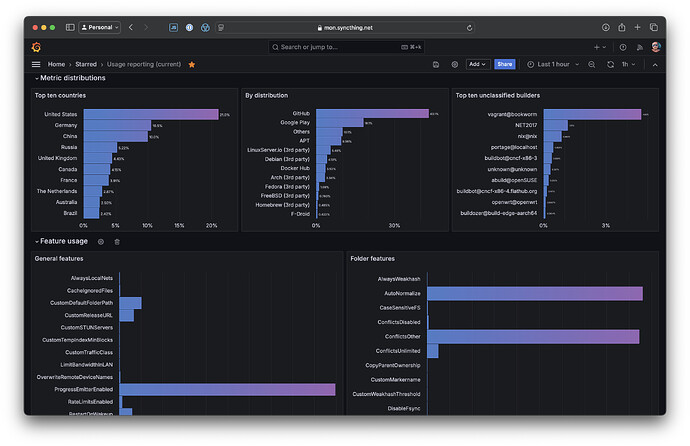
Currently those look like this. There’s one for the current state of the population, showing things like feature uptake, version and platform distribution, etc.
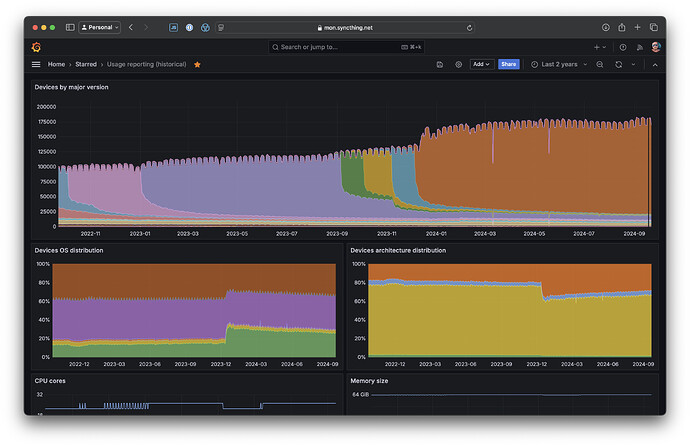
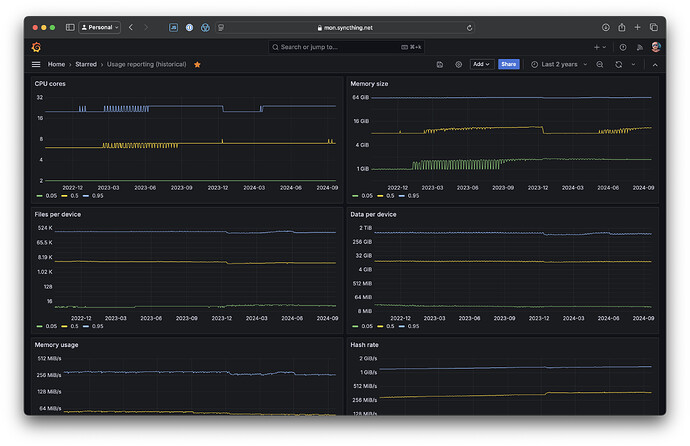
Then there’s another one for historical distributions:
This latter one is the most significant downside with this approach, I think. Our current metrics storage is Mimir, which doesn’t do downsampling of old data. There are other systems that do, like Thanos, but it’s operationally more complex. Lack of downsampling means multi-year graphs must query a lot of data and take a lot of time to return. This is a common issue with Prometheus-based setups, unfortunately.
The upside is that it scales better for the number of devices. There’s a CPU and runtime memory cost that scales linearly with the number of users, but the amount of stored data and the metrics queries are independent on the number of users.
There’s still a lot of data in there that I haven’t specifically added a graph for, but in this case that’s easier for the interested party to data mine. Anyone can log in on mon.syncthing.net using a GitHub account and explore the data.
The code for this is in cmd/infra/ursrv/serve-metrics on the infrastructure branch. The metrics are generated with the help of a set of struct tags on the report struct, defining how they should be aggregated and interpreted.
However, there is a reason to archive the active subset of those reports – being able to do things like this and move to a different system, with backfill of the data from previous years. ↩︎


