High CPU without apparent reason

I noticed several times now, that syncthing uses high CPU without doing anything apparent.

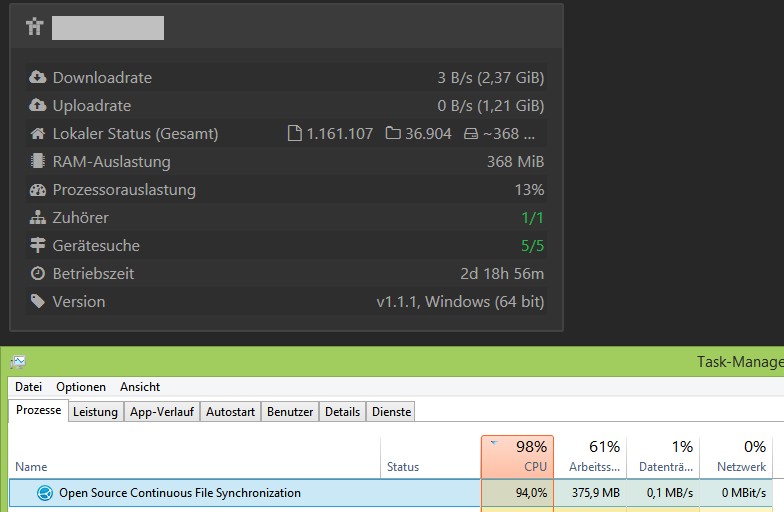
By coincidence i just noticed that this time the high CPU usage started when another client started up and connected. Maybe they were syncing file lists or something like that. Yet the data transfer was pretty low.

After several minutes the CPU usage went down again.

I have installed now Debugging Tools for Windows and next time i see it i will make some stackdumps of the active threads. This should be useful to determine what is happening there.

Until then: Any ideas what is causing this?

Greetings Fred;

Instead of debug view you could also create a cpu profile via https://docs.syncthing.net/users/profiling.html, would even contain more information.

There’s a bit of housekeeping going on when a device connects: Exchanging config messages, potentially exchanging indexes (both wont show up as high data transfer) and after that, a sync operation is scheduled. Unless there is anything to sync (which it doesn’t look it is), that should all be fairly cheap. Another option is, that it’s web UI related: On connect it might do REST queries to the DB. You could test that by not having the UI open when a device connects.

Here are some stackdumps while the CPU is high.
I hope you can “read” this :slight_smile:

I’ll try the COU profiler, too.

syncthing.exe+0xa9b0
ntdll.dll!SbSelectProcedure+0x133
syncthing.exe+0x1073830


ntdll.dll!NtSetEvent+0xa
KERNELBASE.dll!SetEvent+0xc
syncthing.exe+0x5f25e
syncthing.exe+0x3a67b5


syncthing.exe+0x25e4
syncthing.exe+0x536137
syncthing.exe+0x5757c9
syncthing.exe+0x1096340


ntdll.dll!NtWaitForSingleObject+0xa
KERNELBASE.dll!WaitForSingleObjectEx+0x98
syncthing.exe+0x5f25e


ntdll.dll!NtWaitForSingleObject+0xa
KERNELBASE.dll!WaitForSingleObjectEx+0x98
syncthing.exe+0x5f25e


ntdll.dll!NtWaitForSingleObject+0xa
KERNELBASE.dll!WaitForSingleObjectEx+0x98
syncthing.exe+0x5f25e
syncthing.exe+0x6d53b4


ntdll.dll!RtlRestoreLastWin32Error+0x9
KERNELBASE.dll!GetTickCount64+0x66
KERNELBASE.dll!PostQueuedCompletionStatus+0x183
KERNELBASE.dll!GetOverlappedResult+0x18
mswsock.dll!NSPStartup+0xdf7
ws2_32.dll!WSAGetOverlappedResult+0x9a
syncthing.exe+0x5f25e


ntdll.dll!NtWaitForSingleObject+0xa
KERNELBASE.dll!WaitForSingleObjectEx+0x98
syncthing.exe+0x5f25e


ntdll.dll!NtWaitForSingleObject+0xa
KERNELBASE.dll!WaitForSingleObjectEx+0x98
syncthing.exe+0x5f25e


syncthing.exe+0x53ab41
syncthing.exe+0x373aa3
syncthing.exe+0x53baed
syncthing.exe+0xc300


ntdll.dll!NtWaitForSingleObject+0xa
KERNELBASE.dll!WaitForSingleObjectEx+0x98
syncthing.exe+0x5f25e


ntdll.dll!NtWaitForSingleObject+0xa
KERNELBASE.dll!WaitForSingleObjectEx+0x98
syncthing.exe+0x5f25e
syncthing.exe+0x32383


syncthing.exe+0x53abb6
syncthing.exe+0x197a72
syncthing.exe+0x53baed
syncthing.exe+0xc300


syncthing.exe+0x541386
syncthing.exe+0x540405


KERNELBASE.dll!GetTickCount64+0x50
KERNELBASE.dll!PostQueuedCompletionStatus+0x183
KERNELBASE.dll!GetOverlappedResult+0x18
mswsock.dll!NSPStartup+0xdf7
ws2_32.dll!WSAGetOverlappedResult+0x9a
syncthing.exe+0x5f25e


syncthing.exe+0xbde9
syncthing.exe+0xc5e8
syncthing.exe+0x5f200
syncthing.exe+0xa2a8f8
syncthing.exe+0x4c6f9
syncthing.exe+0x32384
syncthing.exe+0xa2a818


ntdll.dll!NtWaitForSingleObject+0xa
KERNELBASE.dll!WaitForSingleObjectEx+0x98
syncthing.exe+0x5f25e
KERNELBASE.dll!SetEvent+0xc
syncthing.exe+0x5f25e


syncthing.exe+0x44670
syncthing.exe+0x5492f0
syncthing.exe+0x750cc0


ntdll.dll!NtWaitForSingleObject+0xa
KERNELBASE.dll!WaitForSingleObjectEx+0x98
syncthing.exe+0x5f25e
syncthing.exe+0x1073830


syncthing.exe+0x2133f
syncthing.exe+0x2429f
syncthing.exe+0x20ee9
syncthing.exe+0x23f81
syncthing.exe+0x20627
syncthing.exe+0x37b96

I can’t edit my last post (there was a typo “COU” -> “CPU”).

I always get this message: “Body is too similar to what you recently posted.”

Even if i remove 90% of my post. Please can you fix this?!

CPU Profile:

syncthing-cpu-windows-amd64-v1.1.1-170509.pprof (135.3 KB)

syncthing-cpu-windows-amd64-v1.1.1-170548.pprof (79.3 KB)

How can i analyze these pprof files myself?
I just want to take a look inside.

What tool(s) can I use?

Go binary has pprof subcommand that can open the profile and a graph in the web browser, look for guides on the internet for go pprof

Forum software is buggy. I’ve done an upgrade now, finally - it may help, maybe.

2 Likes

go tool pprof -web with the filename appended is what I use.

In your case most of the time is spent in low-level functions of the database, some more in the filesystem (stating) and matching to ignores. So essentially I have no clue what’s going on/why it takes so long.
The latter happens due to scanning, and lots of the time spent in db seems to be triggered from the web UI. Both shouldn’t happen as far as I am concerned - logs with model and api debug logging might sheld light on it.

This topic was automatically closed 30 days after the last reply. New replies are no longer allowed.