ARM Linux: CPU usage 99% for many hours with no progress on syncing

I have a performance issue at ARM linux instance.

HW: Zyxel NSA325 v2, CPU 1.6GHz, RAM 512MB

My storage is pretty big (~600 000 files, > 200 GiB). To avoid high workload on NAS side, all directories on NAS side have zero rescan interval. Means scanned on startup only. But that’s not a problem, as normally I do changes on other computers.

Start of Syncthing on NAS is really slow - it automatically scans the storage. It takes time. Anyway, that’s understandable and not a big problem. The main problem is when it tries to syncronise with desktop - the CPU load is 99% and it takes ages to syncronyse. (Takes hours/days to syncronise what can be directly copied during few minutes)

I think some example can be more descriptive:

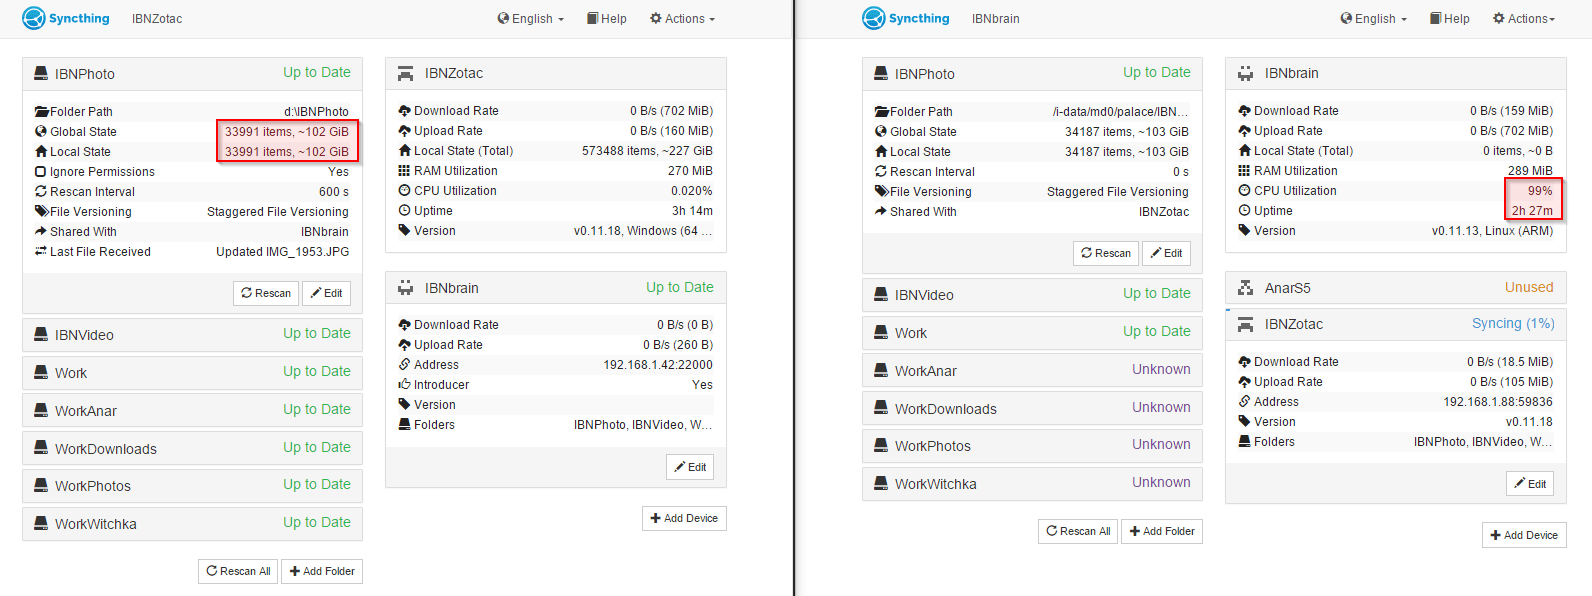
(here is performant intel i7 computer on the left side, and ARM NAS is on the right side)

As you can see, after restart NAS already scanned all directories, and there are ~200 new files in the IBNPhoto directory (total size of new files is ~1GiB).

The intel i7 machine still has old version of the IBNPhoto directory. But NAS has CPU load 99% during last 2.5 hours and transferred only few bits of data. (in fact screenshot was taken more than hour ago, but nothing has changed since then). Also intel machine shows NAS status as ‘disconnected’ from time to time.

Could anybody advice me if it’s possible to make some advanced tuning of the Syncthing at NAS? (like modify ‘pullers’ value for folders, or adjust some other advanced options)

Thanks in advance!

So its most likely due to hashing, but check -help, run a CPU profile, then post it here + full long version that you are running, so someone could have a look at it.

and/or ping timeouts

Why would ping timeouts be cause of high cpu?

I guess the retransfer of the index might be the issue.

Ok, here are some profiling results.

whoops, as new user I can’t upload files. Here is external link:

Here is what was happening:

  1. updated ARM version from 0.11.13 to the latest 0.11.18
  2. stop all Syncthing instances
  3. start ARM instance only (with STCPUPROFILE=yes)
  4. 30 minutes of ARM uptime: all directories got status “Up to Date” and CPU Utilization changed down from 94% to 0.1%
  5. 45 minutes of ARM uptime: start intel instance (v0.11.18, Windows 64 bit). In 1 minute all Windows directories are “Up to Date”, and ARM instance changes status to “Syncing” and its CPU Utilization goes up to 99%
  6. 55 minutes of ARM uptime: only few ~5 files are transfered (on disk ~20MB). On WebUI I see totaly tranfered ~120MiB
  7. 65 minutes of ARM uptime: after 20 minutes of syncronization, totaly ~20 files are tranfered. WebUI says ~220MiB were tranfered (up+down)

(both machines are in local network)

whooops. STCPUPROFILE variable wasn’t exported :slight_smile:

final profile log was collected once again with similar sequence (with step 5 executed after several hours of IDLE). After IDLE, on ARM instance RAM utilization was 57Mb, after I satart second instance, it grow up to ~200Mb (with CPU usage to 100%).

It does sound like index exchange which requires TLS. Also, you did not post the exact long version (with go version build user etc) which is needed.

Full version:

# ./syncthing -version
syncthing v0.11.18 (go1.4.2 linux-arm default) unknown-user@syncthing-builder 2015-08-02 07:19:32 UTC

(the official release from the https://github.com/syncthing/syncthing/releases , the syncthing-linux-arm-v0.11.18.tar.gz file)

But issue was since first version I’ve tried (v0.10.xx)

Yeah, this is a big issue and causes a lot of CPU heating;)

Nothing unusual?

(pprof) top20
Total: 237143 samples
   72565  30.6%  30.6%    72565  30.6% runtime.cmpbytes
   17004   7.2%  37.8%    19812   8.4% runtime.mallocgc
   11455   4.8%  42.6%    11455   4.8% runtime.memmove
    6466   2.7%  45.3%     6796   2.9% github.com/golang/snappy.Encode
    6072   2.6%  47.9%     6752   2.8% github.com/golang/snappy.Decode
    3902   1.6%  49.5%     4149   1.7% syscall.Syscall
    3612   1.5%  51.1%    73022  30.8% github.com/syndtr/goleveldb/leveldb.(*iComparer).Compare
    3565   1.5%  52.6%     3565   1.5% encoding/binary.Uvarint
    3154   1.3%  53.9%    11264   4.7% runtime.makeslice
    2983   1.3%  55.1%     2983   1.3% runtime.MSpan_Sweep
    2583   1.1%  56.2%     2583   1.1% hash/crc32.update
    2424   1.0%  57.3%     3171   1.3% github.com/syndtr/goleveldb/leveldb/cache.(*mBucket).get
    2331   1.0%  58.2%     2331   1.0% runtime.memclr
    2256   1.0%  59.2%    10928   4.6% github.com/syndtr/goleveldb/leveldb/table.(*blockIter).Next
    2233   0.9%  60.1%     3214   1.4% github.com/syndtr/goleveldb/leveldb.iKey.ukey
    2219   0.9%  61.1%     4143   1.7% github.com/syndtr/goleveldb/leveldb/table.(*block).entry
    2088   0.9%  62.0%     2088   0.9% crypto/cipher.(*gcm).mul
    2084   0.9%  62.8%     3555   1.5% bytes.(*Reader).Read
    2082   0.9%  63.7%     6552   2.8% io.ReadAtLeast
    2000   0.8%  64.6%     2000   0.8% scanblock
(pprof) top20 --cum
Total: 237143 samples
       0   0.0%   0.0%   220918  93.2% runtime.goexit
       1   0.0%   0.0%   135612  57.2% net/http.(*conn).serve
       0   0.0%   0.0%   135146  57.0% main.func·004
       1   0.0%   0.0%   135146  57.0% net/http.HandlerFunc.ServeHTTP
       0   0.0%   0.0%   135146  57.0% net/http.serverHandler.ServeHTTP
       0   0.0%   0.0%   135143  57.0% main.func·008
       0   0.0%   0.0%   134879  56.9% main.func·006
       0   0.0%   0.0%   134826  56.9% main.func·009
       1   0.0%   0.0%   134826  56.9% net/http.(*ServeMux).ServeHTTP
       0   0.0%   0.0%   134817  56.9% main.func·005
       0   0.0%   0.0%   134812  56.8% main.func·002
     598   0.3%   0.3%   122908  51.8% github.com/syndtr/goleveldb/leveldb.(*DB).get
     326   0.1%   0.4%   115324  48.6% github.com/syndtr/goleveldb/leveldb.(*Snapshot).Get
     266   0.1%   0.5%   109834  46.3% github.com/syndtr/goleveldb/leveldb.(*version).get
     567   0.2%   0.7%   109518  46.2% github.com/syndtr/goleveldb/leveldb.(*version).walkOverlapping
       0   0.0%   0.7%    97749  41.2% github.com/syncthing/syncthing/internal/db.(*FileSet).WithGlobalTruncated
     461   0.2%   0.9%    97749  41.2% github.com/syncthing/syncthing/internal/db.ldbWithGlobal
     491   0.2%   1.1%    96218  40.6% github.com/syndtr/goleveldb/leveldb.func·033
     298   0.1%   1.3%    91881  38.7% github.com/syndtr/goleveldb/leveldb.(*tOps).find
     142   0.1%   1.3%    87498  36.9% github.com/syndtr/goleveldb/leveldb/table.(*Reader).Find

Seems that serving webrequests is a big struggle for the device. But I am bad at profiling to be honest. Perhaps @calmh can spot something.

Looks like database activity. Would need to look at callers of cmpbytes for the full truth, but I think that’s usually leveldb.

Shall I do some more profilings (like STPERFSTATS)? If necessary, I also can collect profiling with much more sync activities (in the log I’ve posted - there were only 20 minutes of sync, while startup scan was > 30 minutes).

Also I can remove whole 100Gb directory from i7 instance, and then let sync it from ARM instance. AFAIR it takes more than 24h to sync such amount of data.

You can also try the bolt build, perhaps that will help it.

What is that? Where can I get it?

Ah, found: http://build.syncthing.net/job/syncthing-bolt/ Will check tonight.

1 Like

:slight_smile: life is pain

in the evening I’ve started bolt edition. it started indexing. next morning I realized it’s down.

now when I try to start, getting following error:

/ffp/start# ./syncthing.sh
/ffp/start# [monitor] INFO: Starting syncthing
[57PPE] INFO: syncthing v0.11.18+11-g3c85656-boltdb (go1.4.2 linux-arm default) unknown-user@syncthing-builder 2015-08-06 07:34:14 UTC
[57PPE] INFO: My ID: 57PPE6U-QJRCQ5V-L4IBEJP-C55KJ32-4X26UDD-WWKC5NA-PCZ4XLC-25DU6AD
[57PPE] FATAL: Cannot open database: cannot allocate memory - Is another copy of Syncthing already running?
[monitor] INFO: Syncthing exited: exit status 1

The index-v0.12.0.boltdb is 2048Mb

Also found two panic files:

panic: deadlock detected

panic-20150807-034817.log (59.2 KB)

fatal error: fault

panic-20150807-062551.log (31.2 KB)

Note: the old leveldb folder size is 300Mb

Something is going really slowly on that box, and it seems not to be coping. The “cannot allocate memory” panic is fairly straight forward - it’s out of memory. “fatal error: fault” is a mystery to me… The deadlock seems to be because a database scan (requested by the GUI, at the same time it’s doing initial scans) is taking long enough to trigger the deadlock detector…

Is there anything I can do to help investigate the issue?

I think the issue is solely that the device is slow and Syncthing (actually, Go) isn’t very well optimized for ARM. Leave it be, and don’t open the GUI, and it should complete the scan and be happy at some point.

I had similar problems with a very old ARM-based NAS. I changed the pingTimeoutS to 300 and the pingIdleTimeS to 600, based on a tip here on the forum. It seems that if a ping do not get answered, a reconnection and a rescan is initiated, which takes a lot of cpu.

With the above changes it works well for me, even with a slow device.