A CPU profile is not really the right tool here as you’re probably looking for something blocked on I/O or a mutex. Taking a goroutine dump and looking through that for goroutines that have stalled for two minutes, and then figuring out why, will get you closer.
The least destructive way to do that is to run with STPROFILER and then surf to (profiler-listen-address)/debug/pprof/ (IIRC).
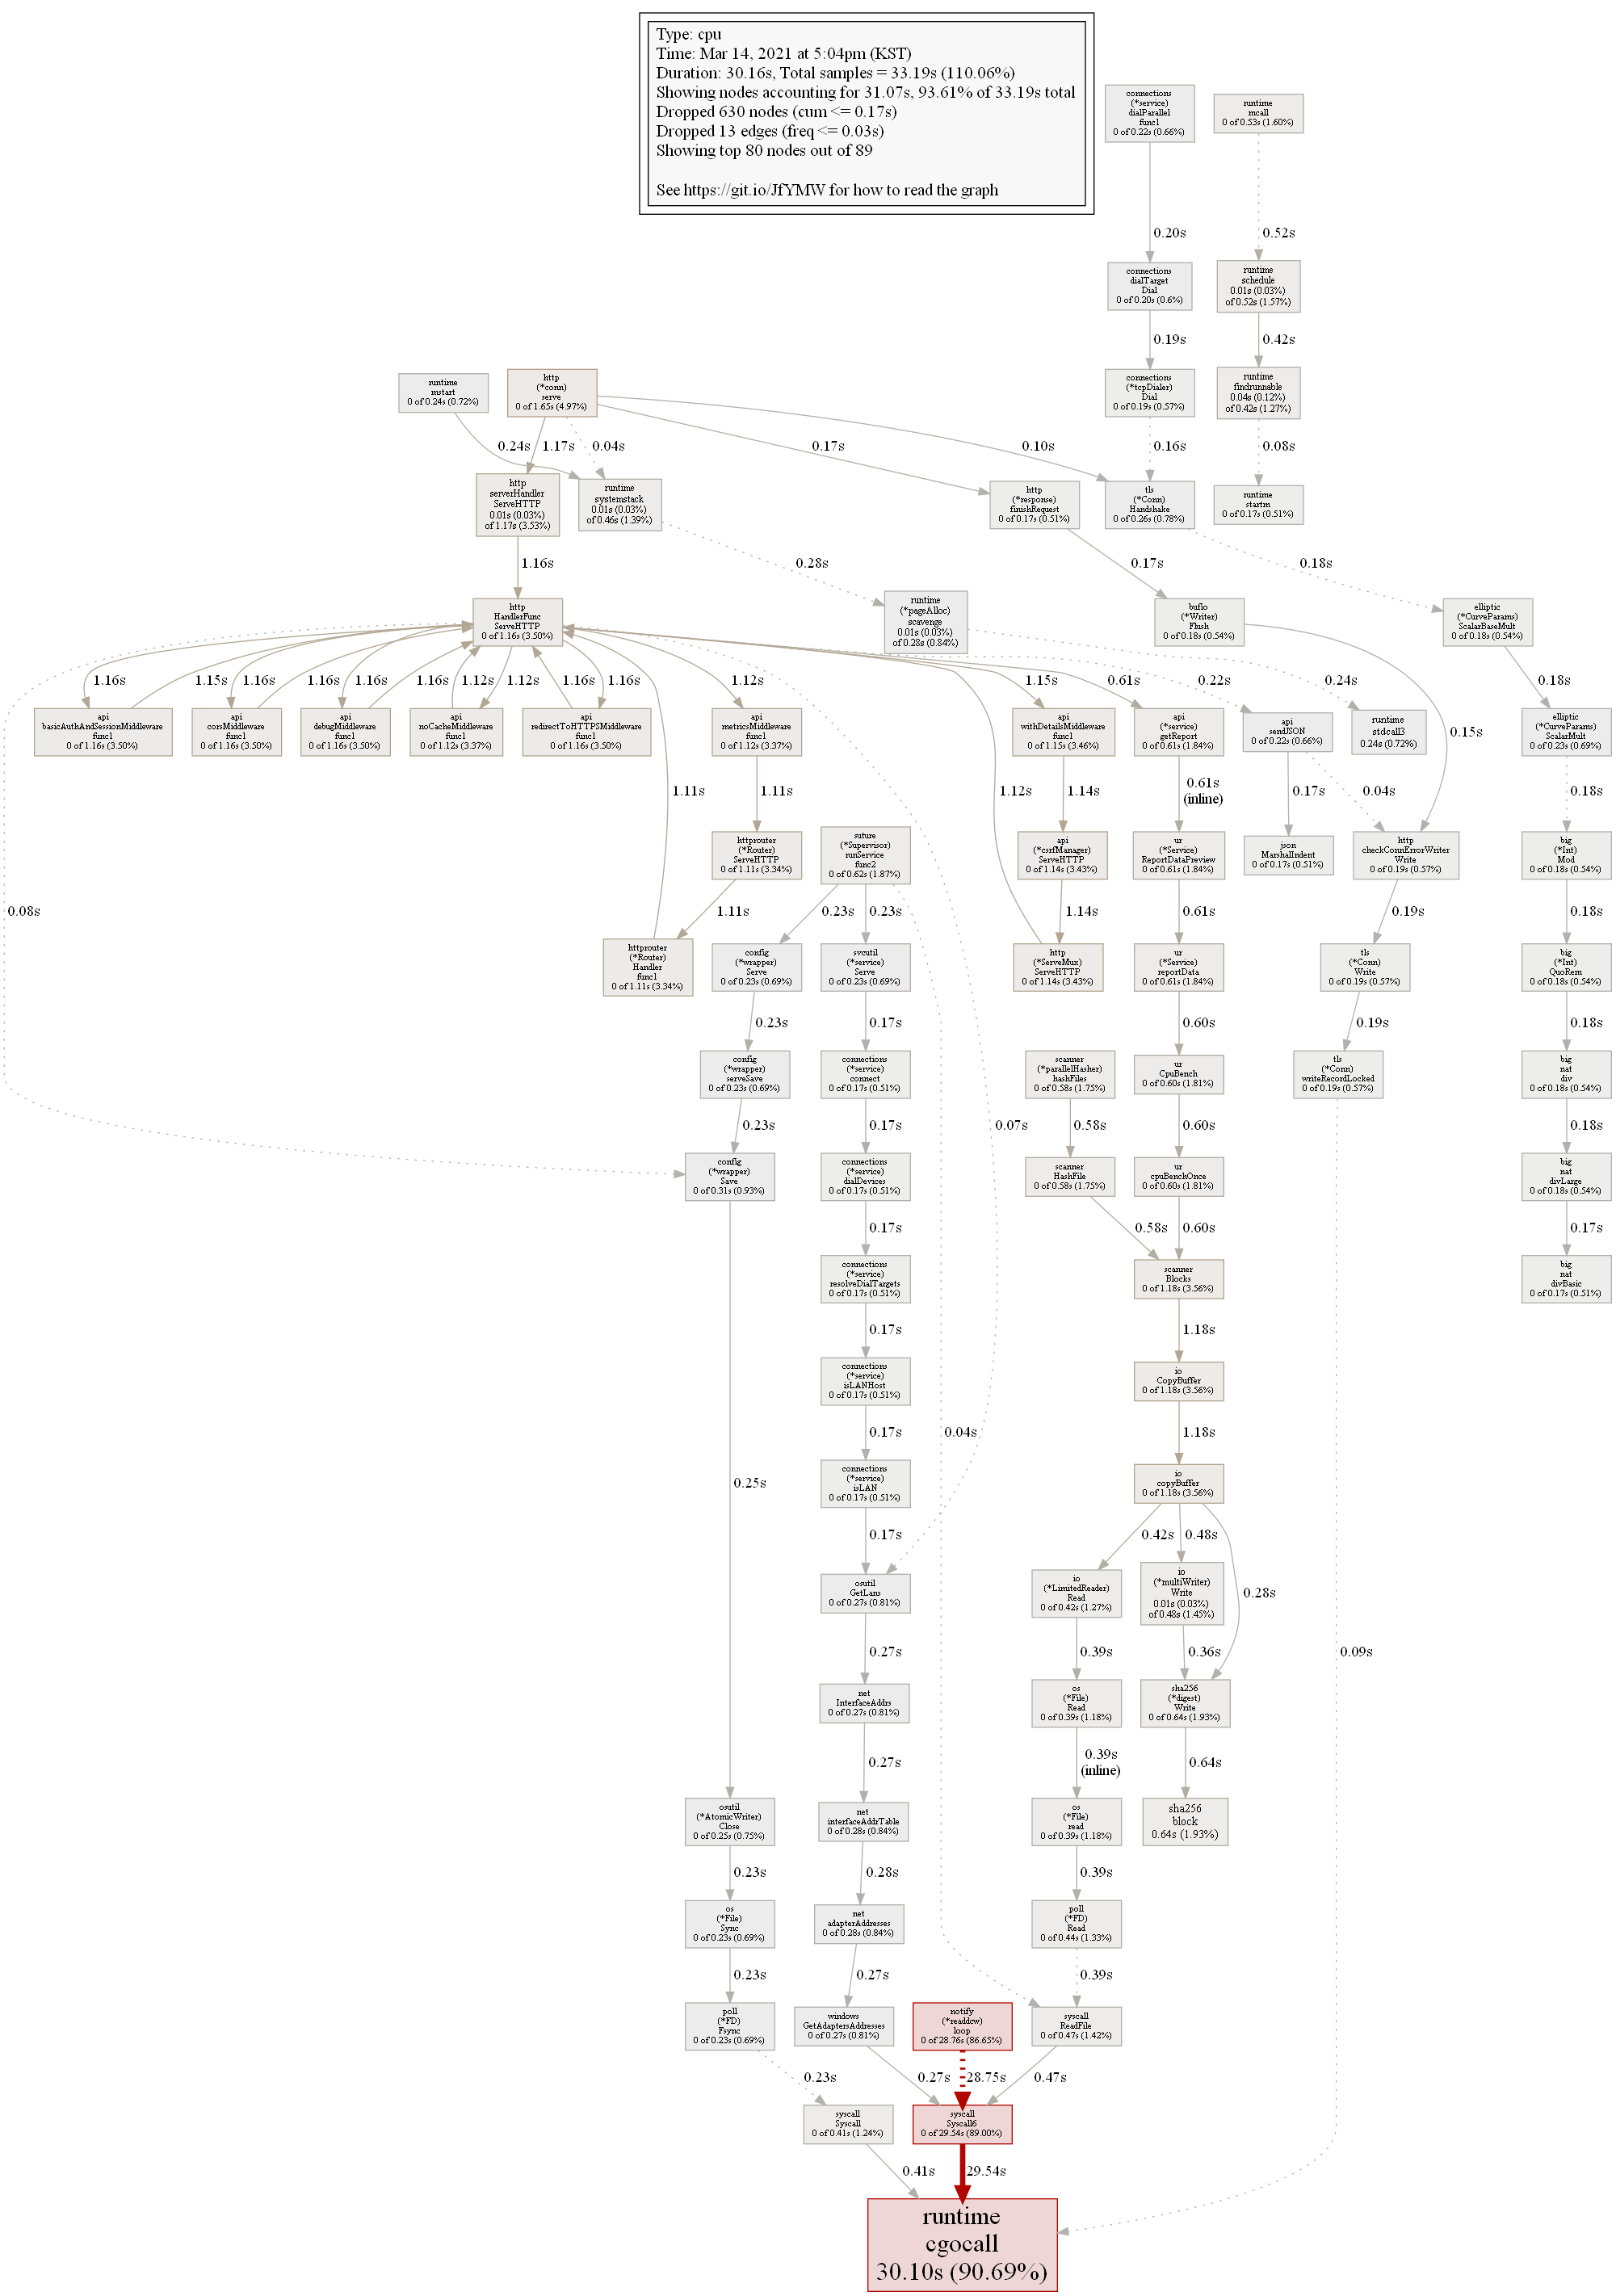
In the second cpu profile almsot all time is spent in syscalls triggered by notify. In the first one it’s just about 7s/30s. Still might be something related to IO and filesystem watcher.
STPROFILER was not enabled then, so I couldn’t take a proper profile. Now it is, but I haven’t experienced the issue so far .
I’m ready though, so once this happens again, I should be able to provide more information.
Also, if this turns to actually be I/O related, then there is a possibility that the culprit may be a flaky RAID that I have here (which I’m intending to dismantle soon).
I’m finally back with some more data on this one. I have just had a situation with the GUI getting completely stuck after trying to unpause several folders at once.
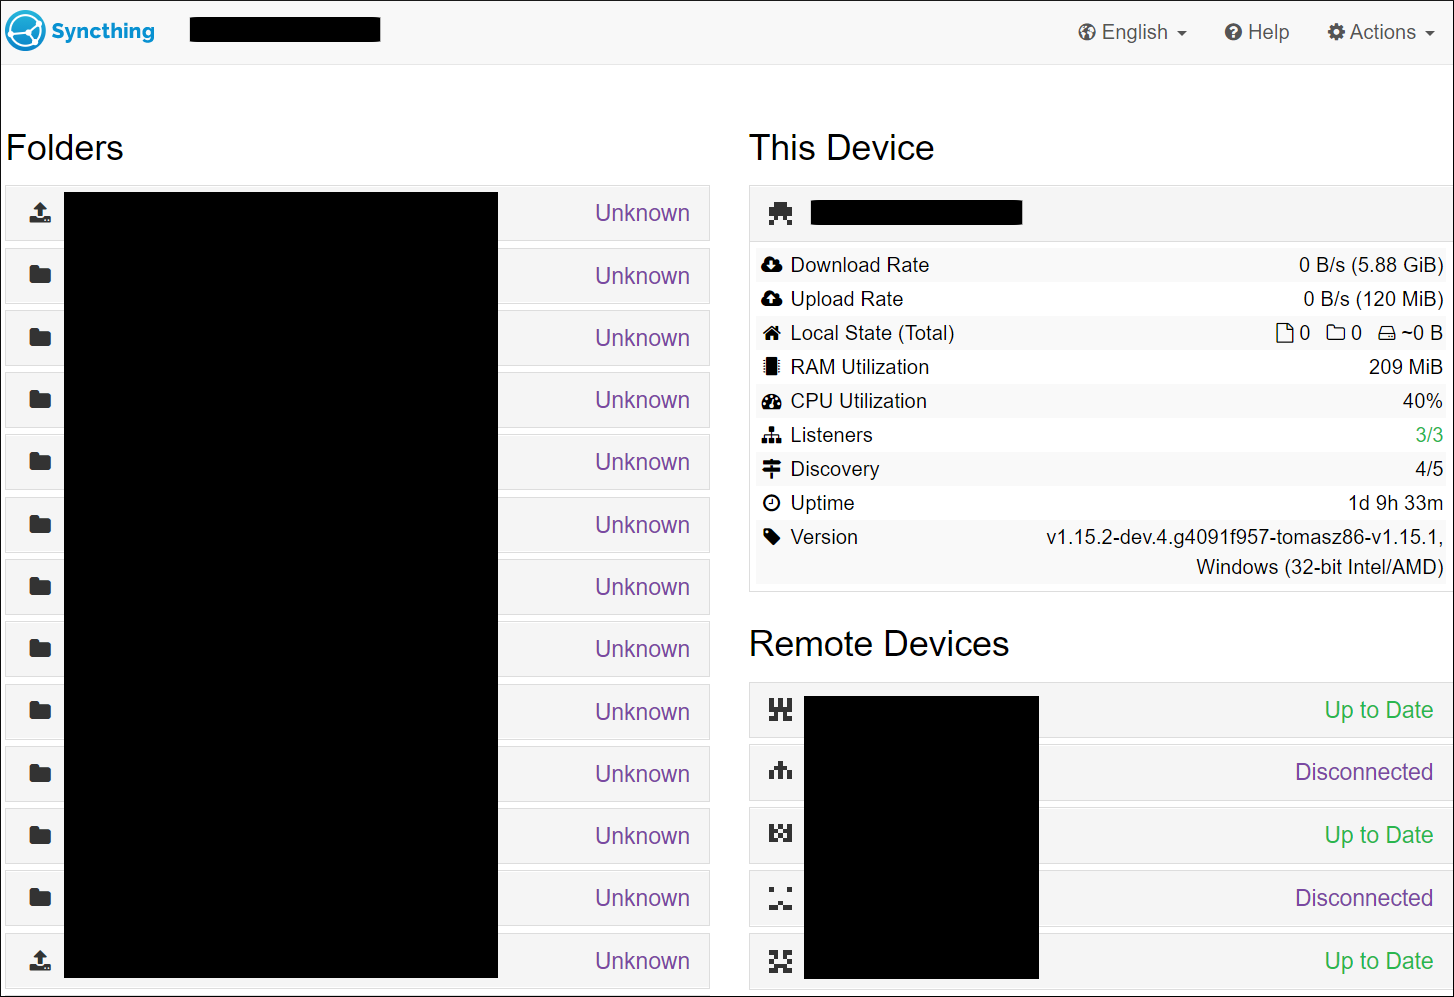
This is how it looked like in the browser. All the folders are “Unknown”, and the local state has been zeroed.
I have also tried running go tool pprof http://localhost:9090/debug/goroutine, but the problem is that I only managed to run it a few minutes later after the goroutine downloaded above, and the GUI had already managed to come back to life in between, so I’m not sure how useful the screenshot below is, but I’m including it anyway.
In short, the GUI was stuck like that for about 5-10 minutes, and then it suddenly refreshed and began to work normally again. Does this provide more information on what the culprit may be here?
Without being able to reproduce: No. Maybe there’s filesystem operations, but it’s a very long shot and you can’t run with that debug logging on all the time. I’d also try disable filesystem watching, again a long shot due to the first profiles, and again not really something you want to do in production. Check system resources when it next happens, maybe there’s something there.
Thank you. I will try to check the OS monitoring tools next time this happens. Just a quick question though, is there any performance penalty for running with STPROFILER and <gui debugging="true"> all the time?
debugging has none, STPROFILER needs some resources collecting and writing the info, but I wouldn’t expect any noticable effect on overall performance.

 .
.