I have experienced this very strange issue today. Basically, Syncthing was stuck for about ~30 minutes on one device. The GUI showed two folders being scanned, and the other device was shown as connected, but nothing was happening in reality. Then, after some time had passed, Syncthing suddenly resumed its activity.
I tried enabling db and model logs, but nothing was being written to the log even after doing so. Also, when trying to pause the other device, the GUI did change its state to paused, but if I tried to unpause the device again, then it immediately showed the device as connected, without actually going into the disconnected state. At the same time, the stuck device was being reported as disconnected on the other side.
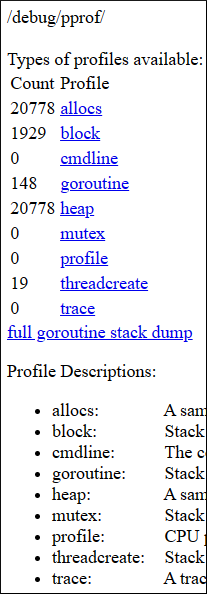
The synchronisation has come back to normal right now, but I did take http://localhost:9090/debug/pprof when the device was still stuck. I would be very thankful if you can have a look at it and check whether there is anything useful there.
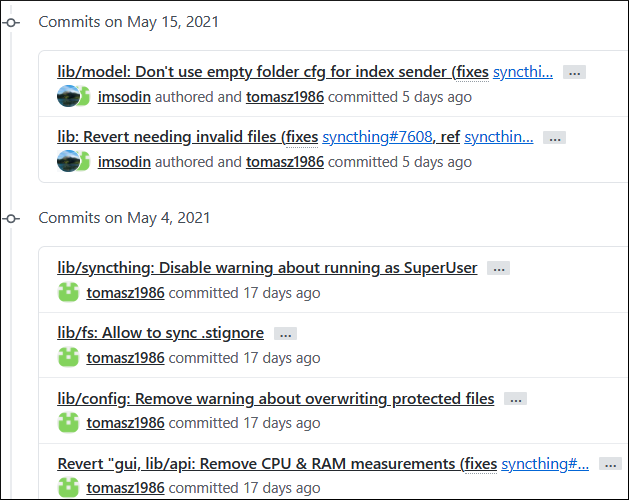
That’s not a profile, but a goroutine dump. There’s a connection waiting a long time for closing. Can’t make sense of the line numbers though - what version is this?
Hmm, there are only two devices involved here - XZZTDIY and D4DZUGP. The former is connected only to the latter, and it is the one that is stuck, and also from where the dump comes from. The latter is connected to multiple devices, but there everything has been working smoothly.
This is how the situation on XZZTDIY generally looks like.
As you can see, not that much is going on really. Also, the two devices are located on the same (W)LAN with decent speeds and no bandwidth limits. They also connect directly by IP addresses in Syncthing.
I just stopped looking at the goroutines too quickly when the line numbers didn’t make sense: The cause is compaction at the end of the database garbage cleaner holding up an index update, which prevents the connection to close and through holding model locks, stalls everything. It’s waiting since 21min for the compaction to finish. Is this a specially slow db (large, on harddisk, …)?
I just skimmed and noticed “pprof”, expected a .pprof and did get a goroutine dump. I am still confused about what you did - I am not aware that we are running some pprof thing at 9090. Not that it matters much, the goroutine dump is useful.
Not really… The DB takes about 500 MB on the disk, and the storage itself is eMMC flash storage. Not the fastest in the world, but definitely not the slowest either.
Disk  Random 16.0 Read                       31.41 MB/s
Disk  Sequential 64.0 Read                   103.59 MB/s
Disk  Sequential 64.0 Write                  27.78 MB/s
Average Read Time with Sequential Writes     1.023 ms
Latency: 95th Percentile                     2.204 ms
Latency: Maximum                             148.031 ms
Average Read Time with Random Writes         0.667 ms
Also, nothing else was really going on on the machine at that time, except for having the Web GUI open remotely on a different computer. Can the CPU be the culprit here? It is rather weak (Intel Atom Z3740), but not that slow either…
Edit: The compaction seems to be occurring again at the very moment, because the GUI is stalled in the same way, and the DB has grown to 700+ MB, and now is shrinking again. However, the CPU is only being used in about 10-15%.
Thanks for the analysis regardless, and it is good to know that the stall was due to a normal operation, and not something unusual.
I don’t expect GC is doing that much (unless you have an enormous amount of synced changes every day), however there’s no way to find out right now. I added some logging regarding that in the following PR - can you run with that and report the lines mentioning “Database GC” please: https://github.com/syncthing/syncthing/pull/770
All good, I just genuinely wasn’t aware/forgot about STPROFILER - thanks for explaining
How much would that be? I have a at least a few hundred MBs changed per day, but those are mostly the same files being modified over and over.
From time to time there may also be a mass change of tens of thousands of tiny files (e.g. 50,000), but they all together take a dozen of MBs maximum. Does the number of changed files matter regarding GC, or only the size?
I wasn’t thinking of any specific number, I just assumed you wouldn’t be changing a big fraction of all the files daily. And I just shouldn’t have assumed anything and asked you how much changed
There are two things that can create work for GC: Any change if more than 10 devices have previously changed a file. Any change to a file with more than 3 blocks, so most files >386kB (not all due to variable block sizes).
How much it really is for you the added logging can tell. What I am interested in is, if the churn on db compaction also happens if GC deleted only few items. If that is the case, it would likely make sense to have a threshold below which no compaction is triggered.
I have cherry-picked the commit, so let’s see what exactly is going on. I will come back later once there is enough data in the logs. Do I need to enable any specific debug logging for this?
There are fewer than 10 devices in this configuration total, so it would likely be the second case here.
Today I turned on a different computer after about 2 weeks of not using it, and Syncthing immediately started doing GC (which took 30 minutes or so…), even though there was no Internet connection even (i.e. there had been no file changes in between, neither local nor remote).
Unfortunately that machine wasn’t running the binary with the cherry-picked commit, so I cannot give any more information here, but I just wanted to ask, would starting Syncthing after a long period of inactivity also trigger GC?
That’s expected: GC is run periodically (every 13h by default), and last run time is stored. So starting up a device after longer than that will trigger GC immediately.
I checked a GC run on my laptop (db on ssd, ~600MB, ~300k files/dirs) and it took 13s without doing much GC (first msg has 10s delay):
[YPOXT] 10:01:36 INFO: Database GC started - many Syncthing operations will be unresponsive until it's finished
[YPOXT] 10:01:39 INFO: Database GC done (discarded/remaining: 2/34832 blocks, 0/0 versions)
I am really interested in getting your stats to get a bit more of an idea on how long this process takes in different situations.
This is a log from today, from the affected device described originally in this thread.
[XZZTD] 2021/05/26 08:19:50 INFO: Database GC started - many Syncthing operations will be unresponsive until it's finished
[XZZTD] 2021/05/26 08:53:07 INFO: Database GC done (discarded/remaining: 671/13807 blocks, 0/0 versions)
The GC took 34 minutes… The device itself was completely idle at that time, so there was nothing else going on in the OS that could have negative effects on the process. For the record, the antivirus is also turned off there.
Edit:
Here is another log from a desktop PC. This is the fastest computer that I have currently access to.
[D4DZU] 2021/05/26 12:03:41 INFO: Database GC started - many Syncthing operations will be unresponsive until it's finished
[D4DZU] 2021/05/26 12:05:40 INFO: Database GC done (discarded/remaining: 1518/32288 blocks, 0/0 versions)
Is there any way to force GC manually? If yes, then I could try moving the DB to a RAM disk on the very same device, and then test how long it takes to do it there.
Start with --debug-db-indirect-gc-interval=1m or something and you’ll get a GC pass once a minute. Set it to 720h or something and you’ll get it out of your hair for most of the month, resolving this issue. This looks like just slow machine being slow to me.
Based on the logs, it takes 34m to process 671 blocks on Device 1, and just 2m to process 1500 blocks on Device 2. The difference in storage speed between the two is not that drastic though. Device 1 has the eMMC storage benchmarked previously, while Device 2 uses a standard, mid-range SATA SSD.
The difference in CPU power between the two is massive though, and I have a feeling that something may be up right here. The CPU wasn’t used that much when I was checking previously, but it was only the multi-core load. On the other hand, its single-core performance is very weak. Are database operations single-threaded by any chance?
I may try increasing the interval regardless. I would say that another aspect worth paying attention to regarding this issue is that there is no indication in the GUI that something is taking place in the background. In fact, the GUI acts as if it was responding to commands, etc. while in reality it is not, which may lead to confusion, e.g. the user changes some settings, and they don’t get saved until much later.
It’s not really the blocks being processed, but every item announced by any device. So the effort scales to that, not the reported blocks/versions. The blocks/versions are a result of loading each and every item and looking at them . This is indeed a single threaded process.


 .
.